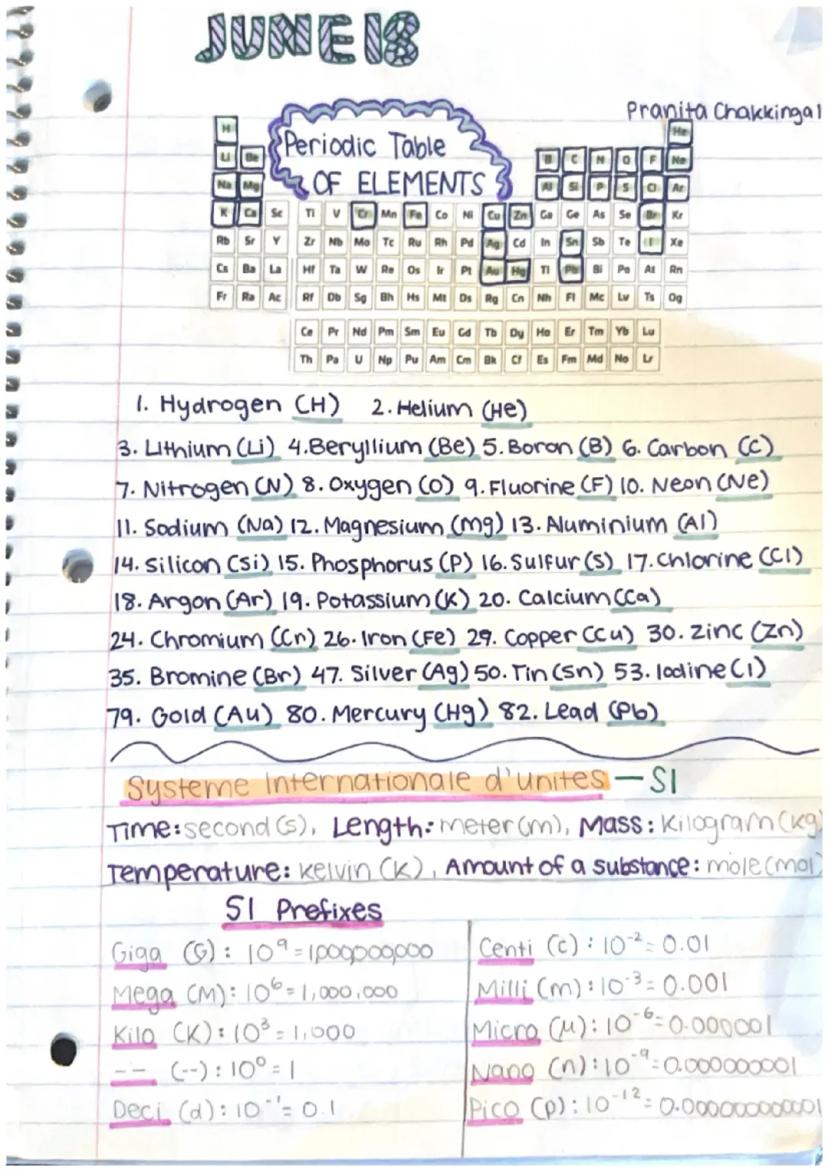
The periodic table elements provide a systematic organization of chemical elements based on their properties and atomic structure. Students can better grasp chemistry concepts by first mastering the fundamentals of element classification and their relationships.
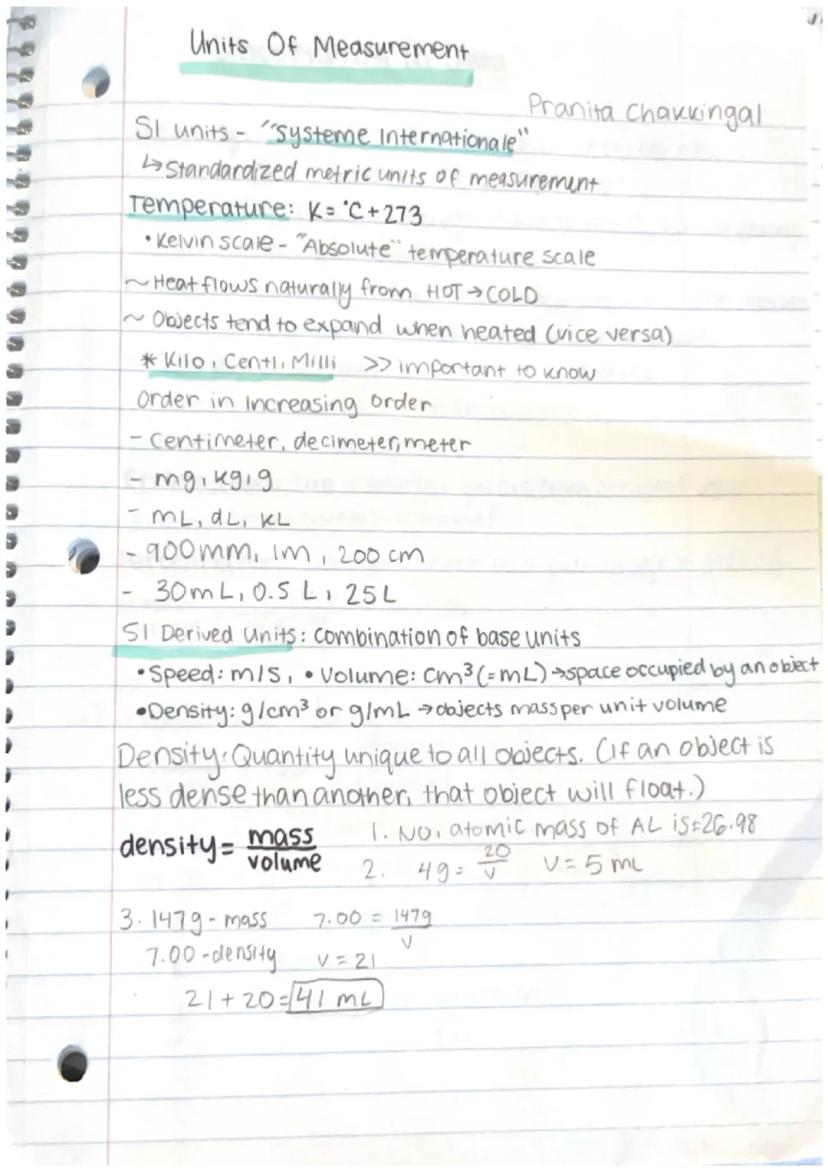
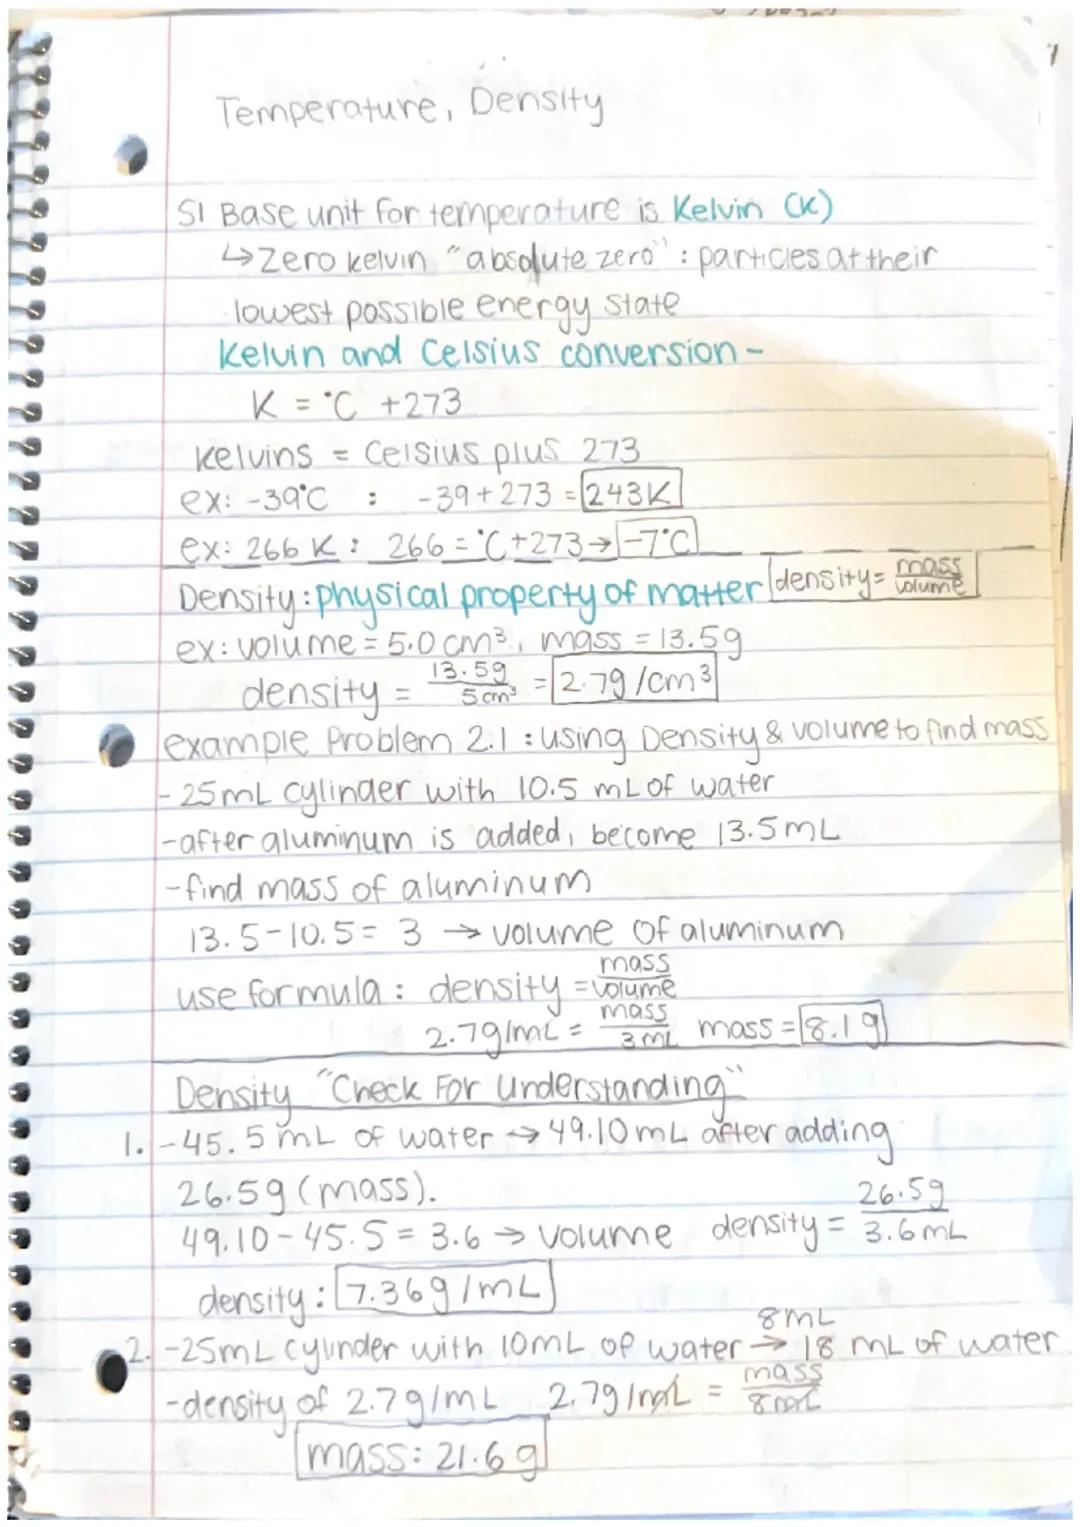
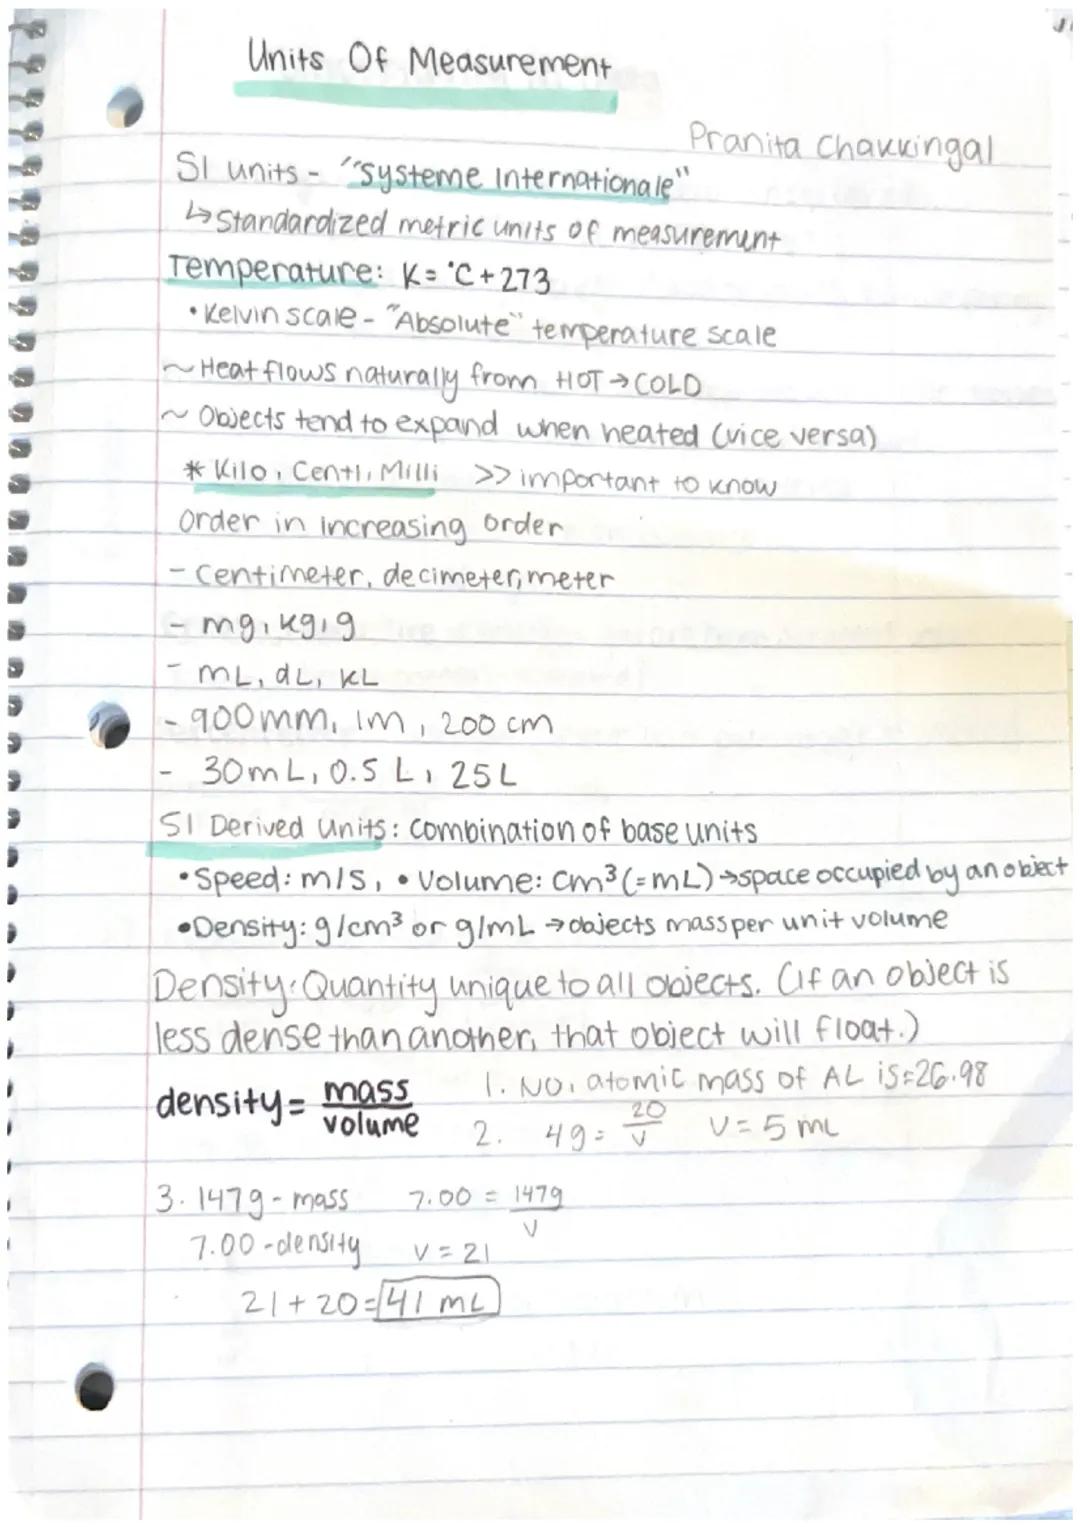
When working with kelvin to celsius temperature conversion examples, it's essential to understand that the Kelvin scale starts at absolute zero (-273.15°C) and increases in the same increments as Celsius. To convert from Kelvin to Celsius, subtract 273.15 from the Kelvin temperature. For example, 300 K equals 26.85°C (300 - 273.15). This relationship helps students understand how different temperature scales relate to each other and why scientists often prefer using Kelvin for calculations. The SI units system provides standardized measurements across scientific disciplines, making it easier to communicate and compare results internationally.
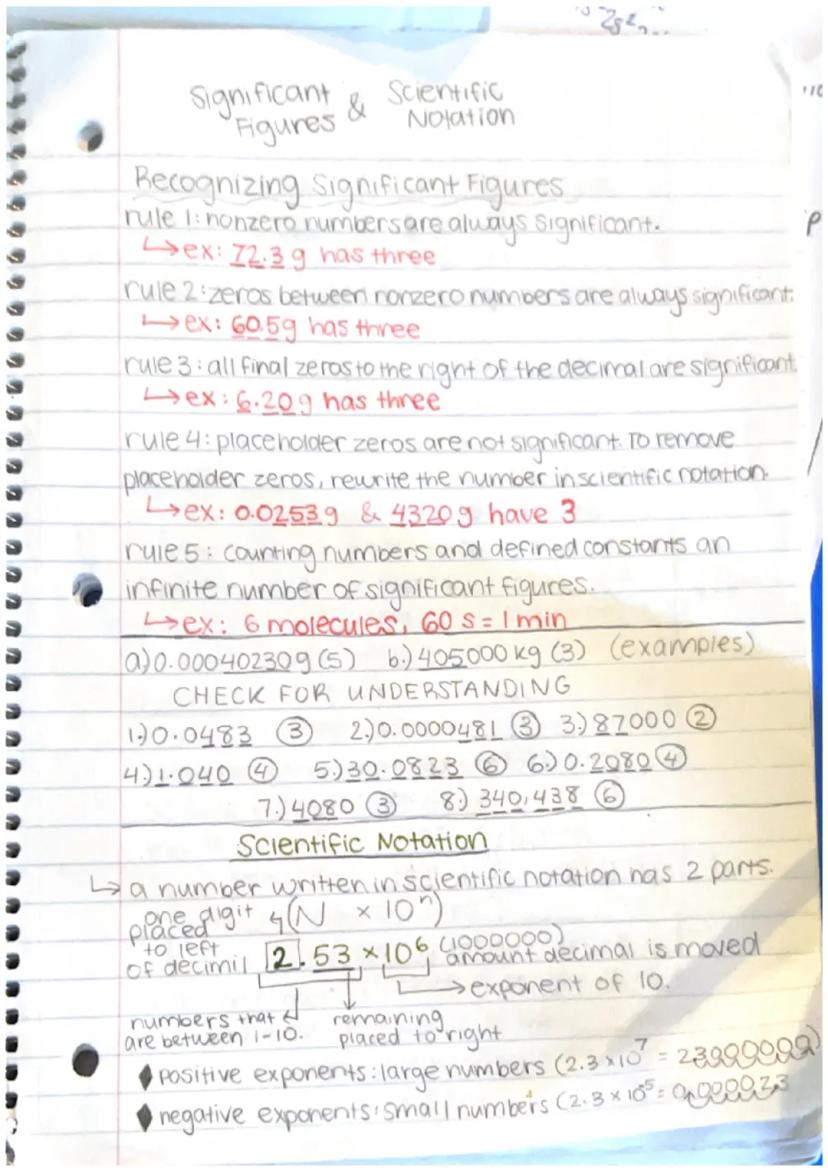
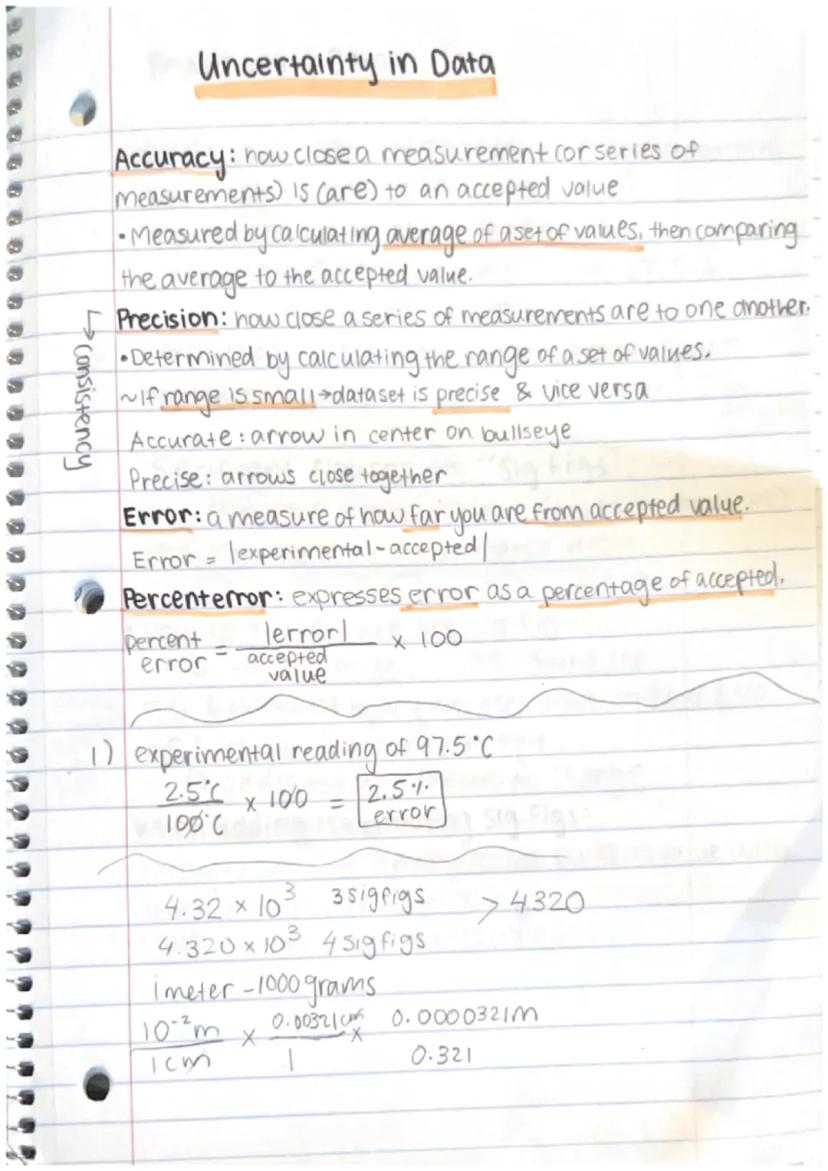
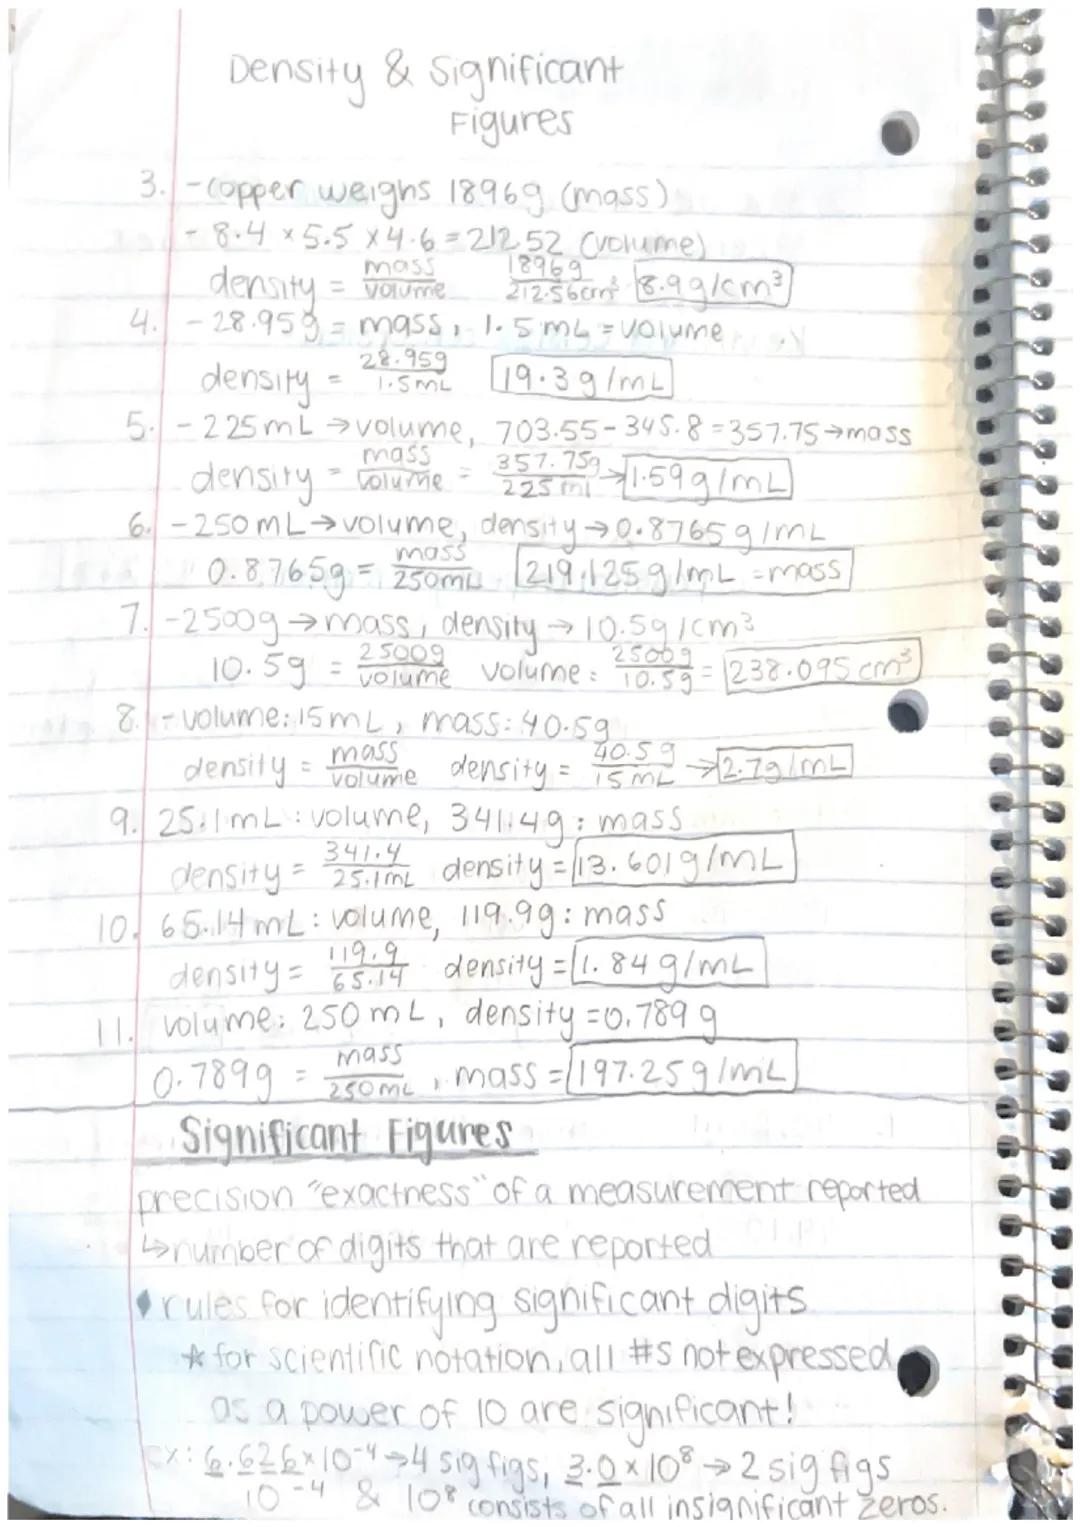
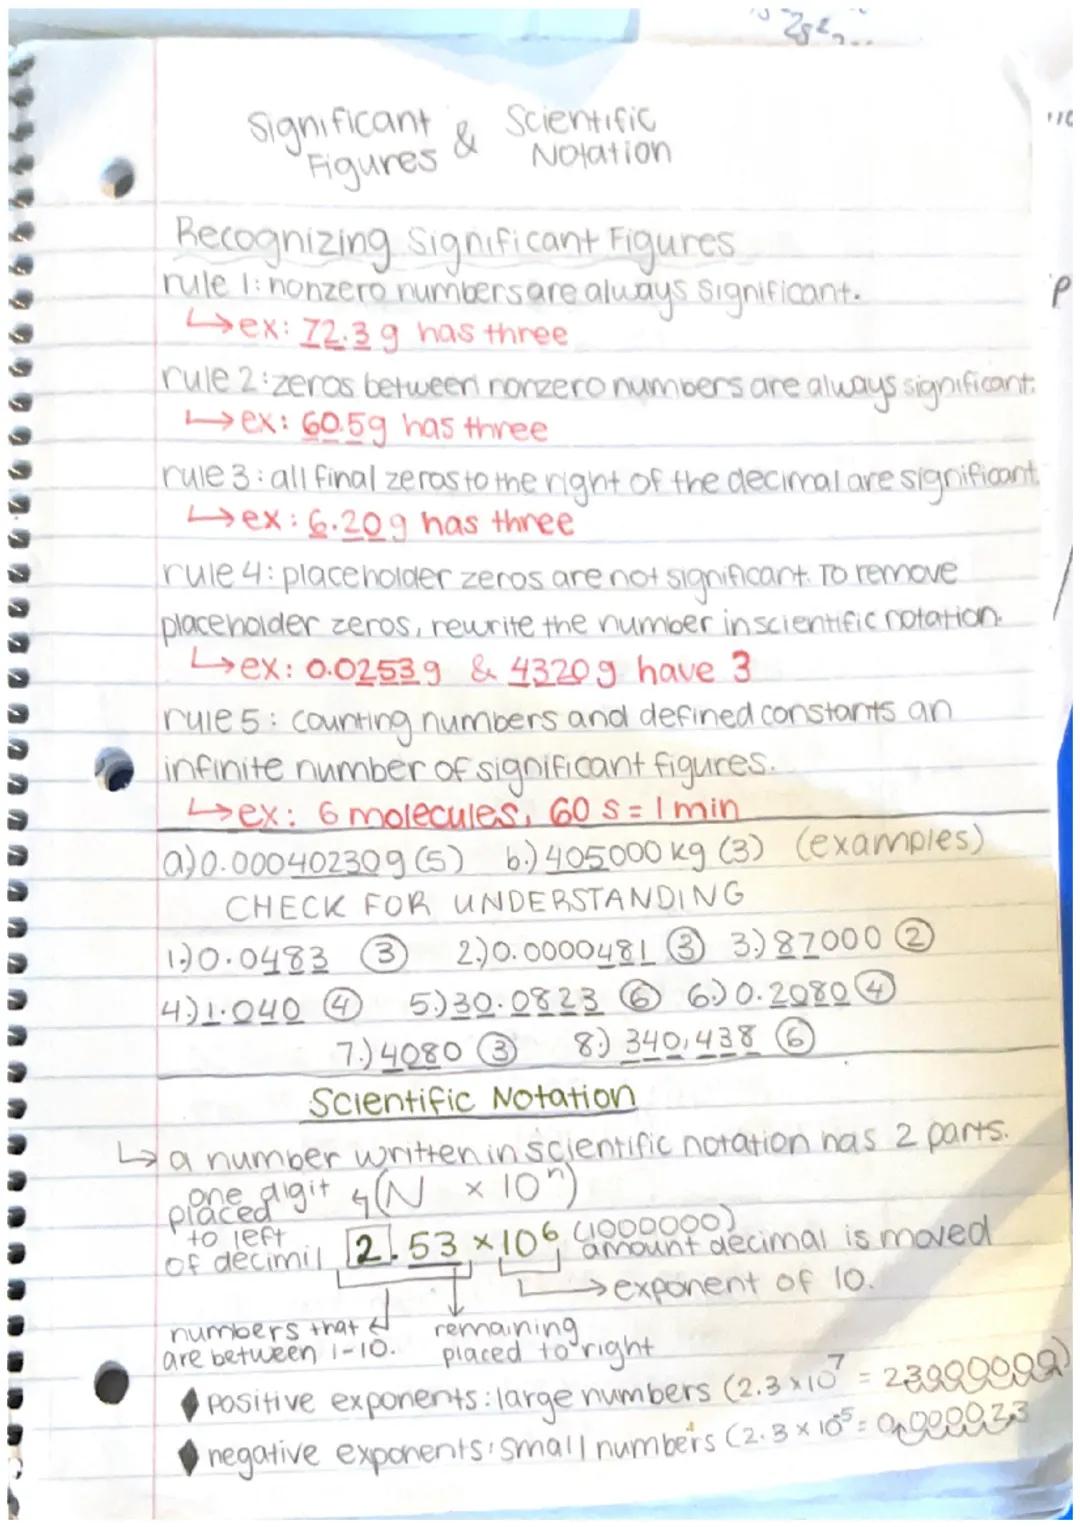
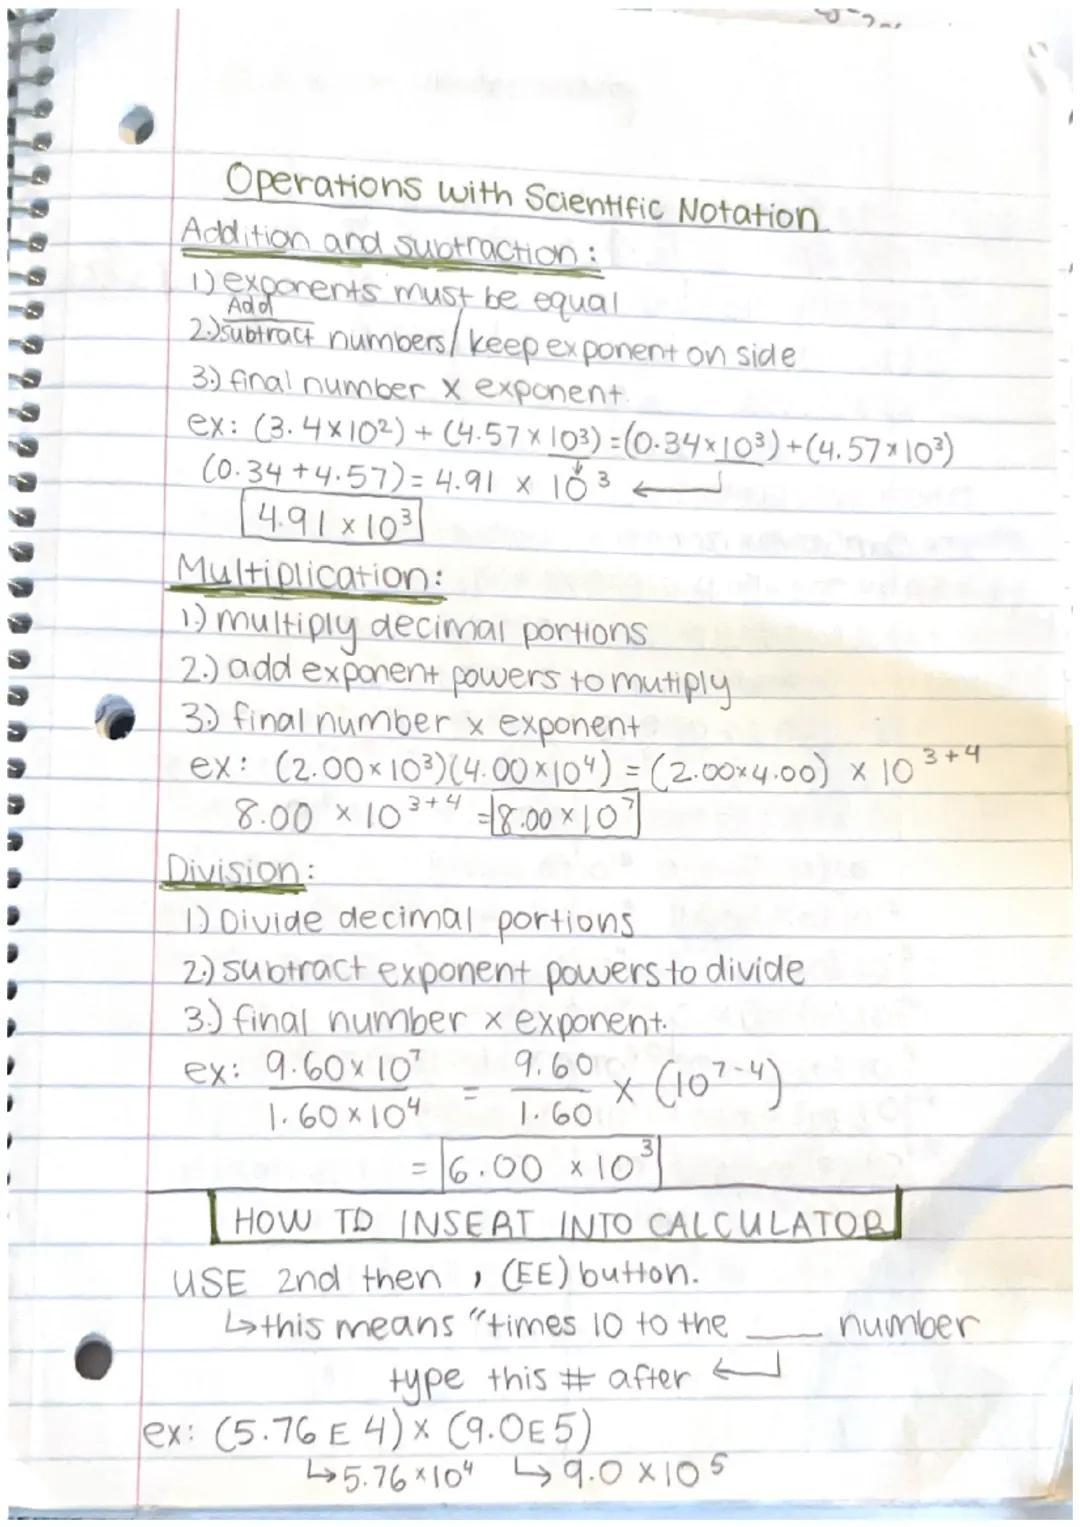
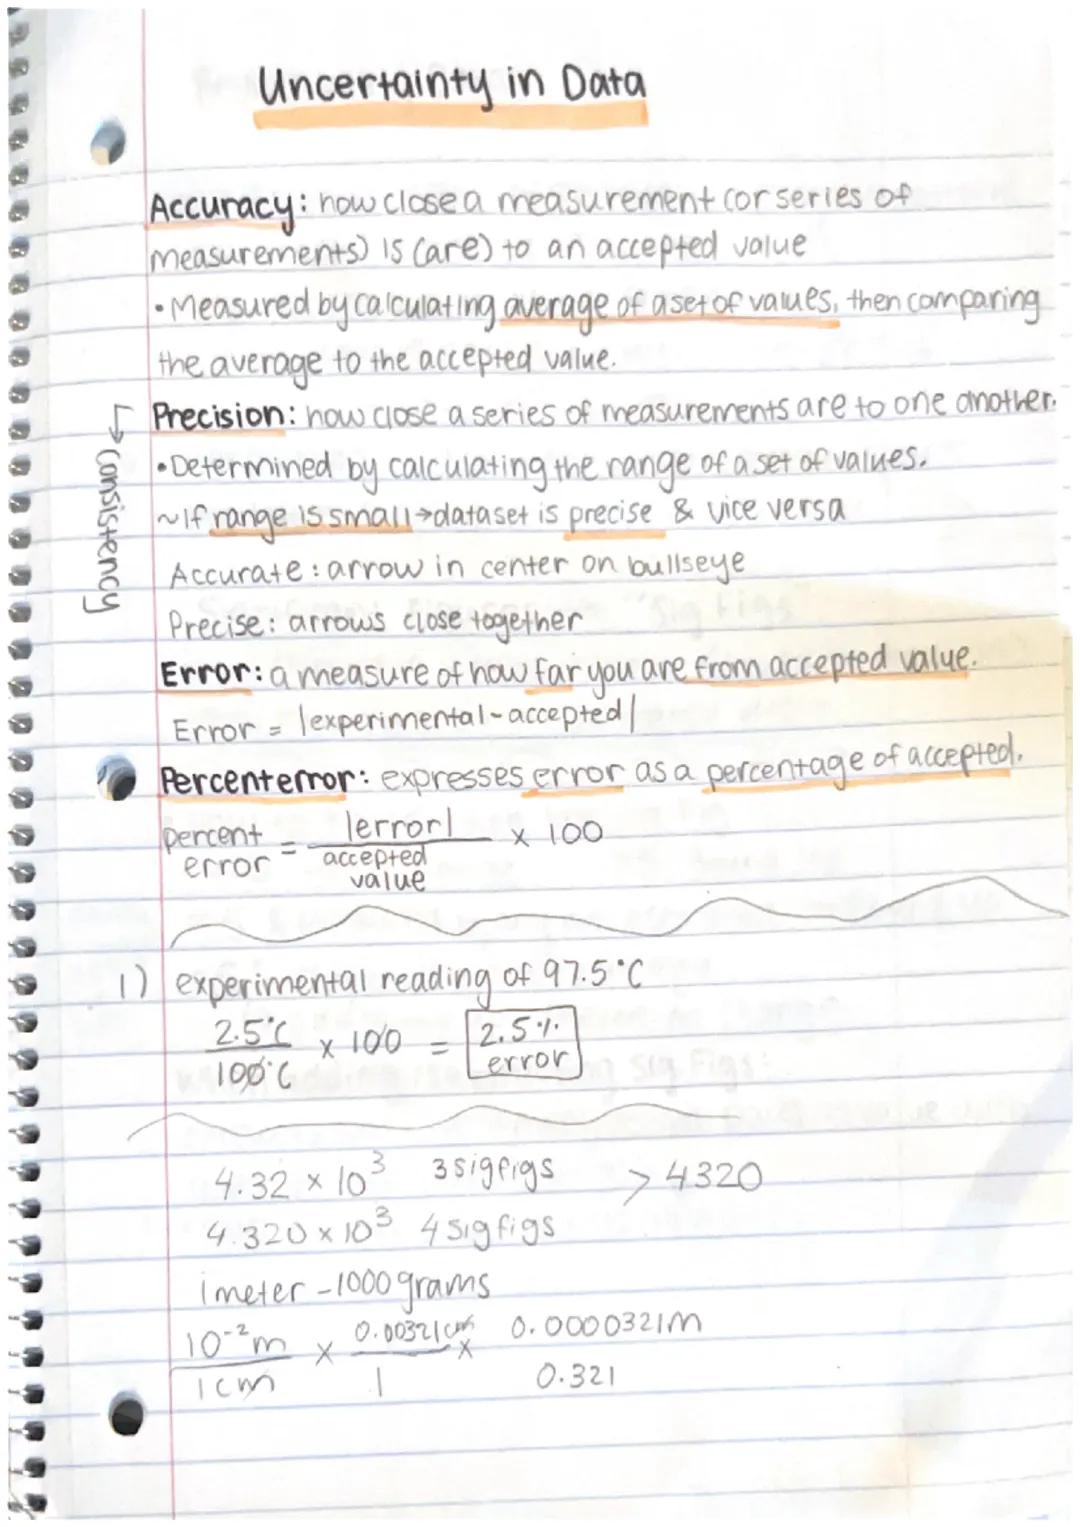
Significant figures and density calculation problems require careful attention to precision and accuracy. When measuring density, students must consider both mass and volume measurements, carrying the correct number of significant figures through their calculations. For instance, if measuring the mass of an object to three significant figures (e.g., 12.4 g) and its volume to two significant figures (e.g., 4.0 cm³), the final density calculation should be reported with two significant figures (3.1 g/cm³). Understanding these concepts helps students develop strong analytical skills and appreciate the importance of precise measurements in scientific work. Additionally, practicing with real-world examples helps reinforce these mathematical principles while demonstrating their practical applications in laboratory settings.