Welcome to your crash course in accounting and finance fundamentals!...
Hercules CPA - MS Notes for Last Minute Prep
studywithnessa@studywithnessa


1 / 6
1
of 6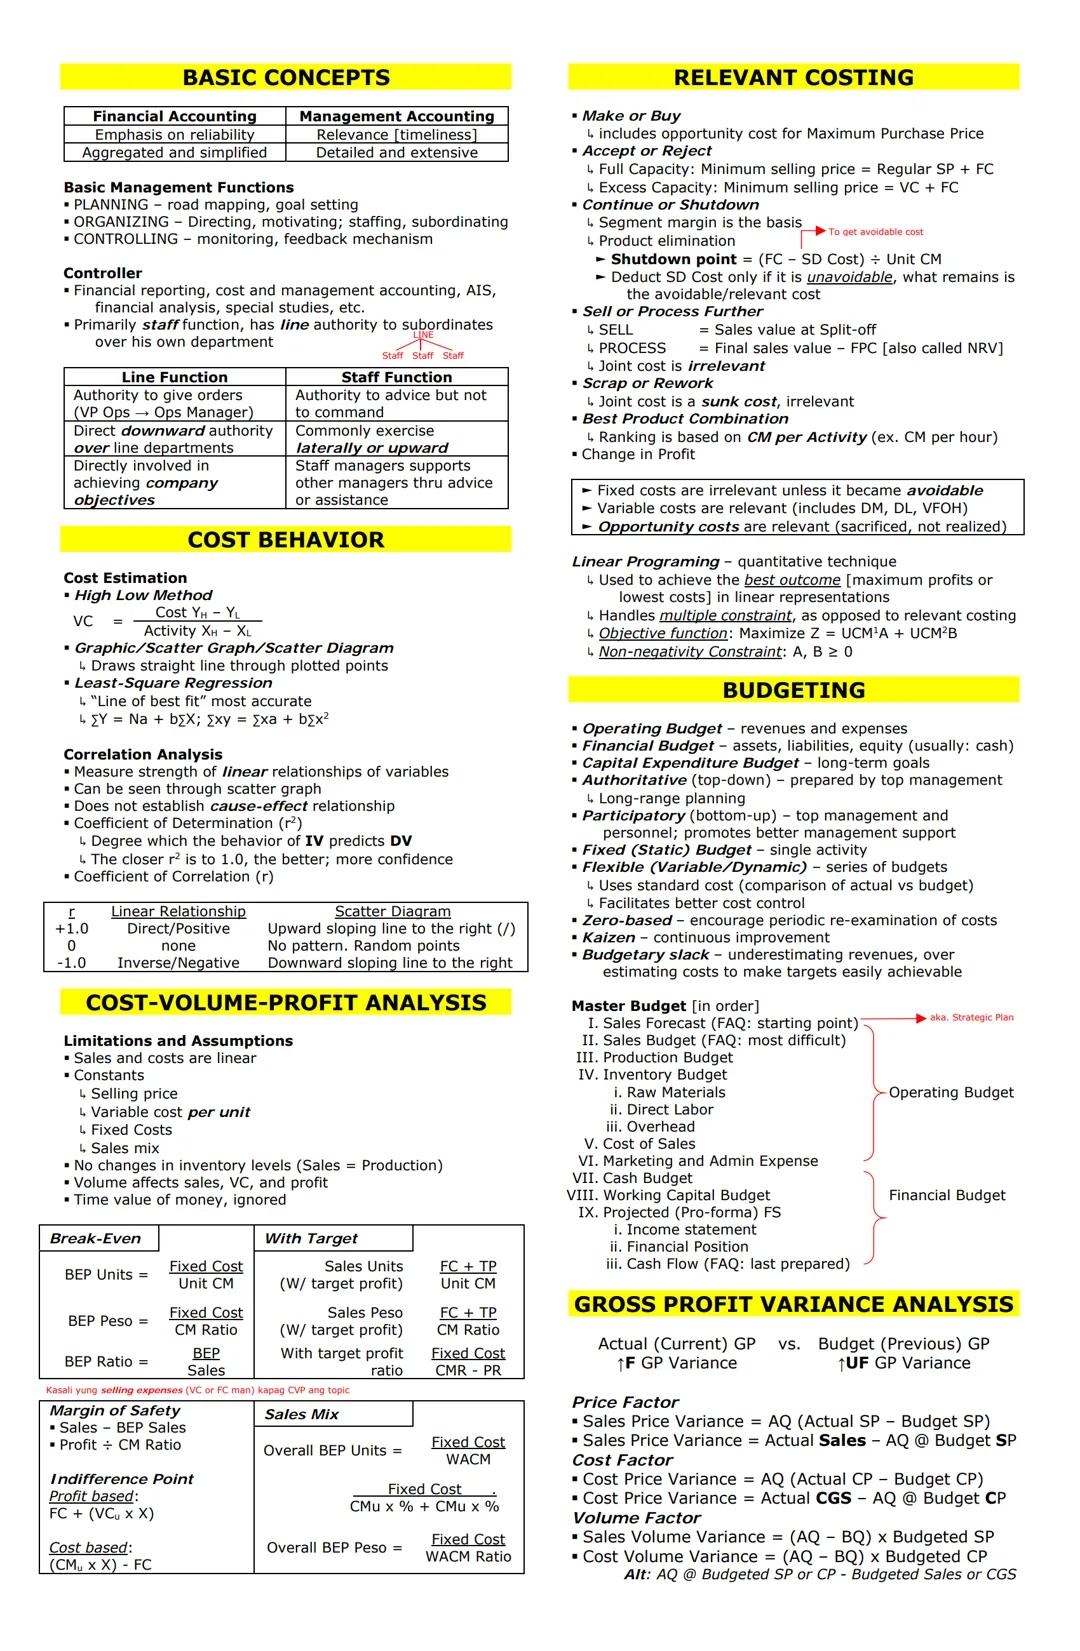
Basic Concepts and Cost Behavior
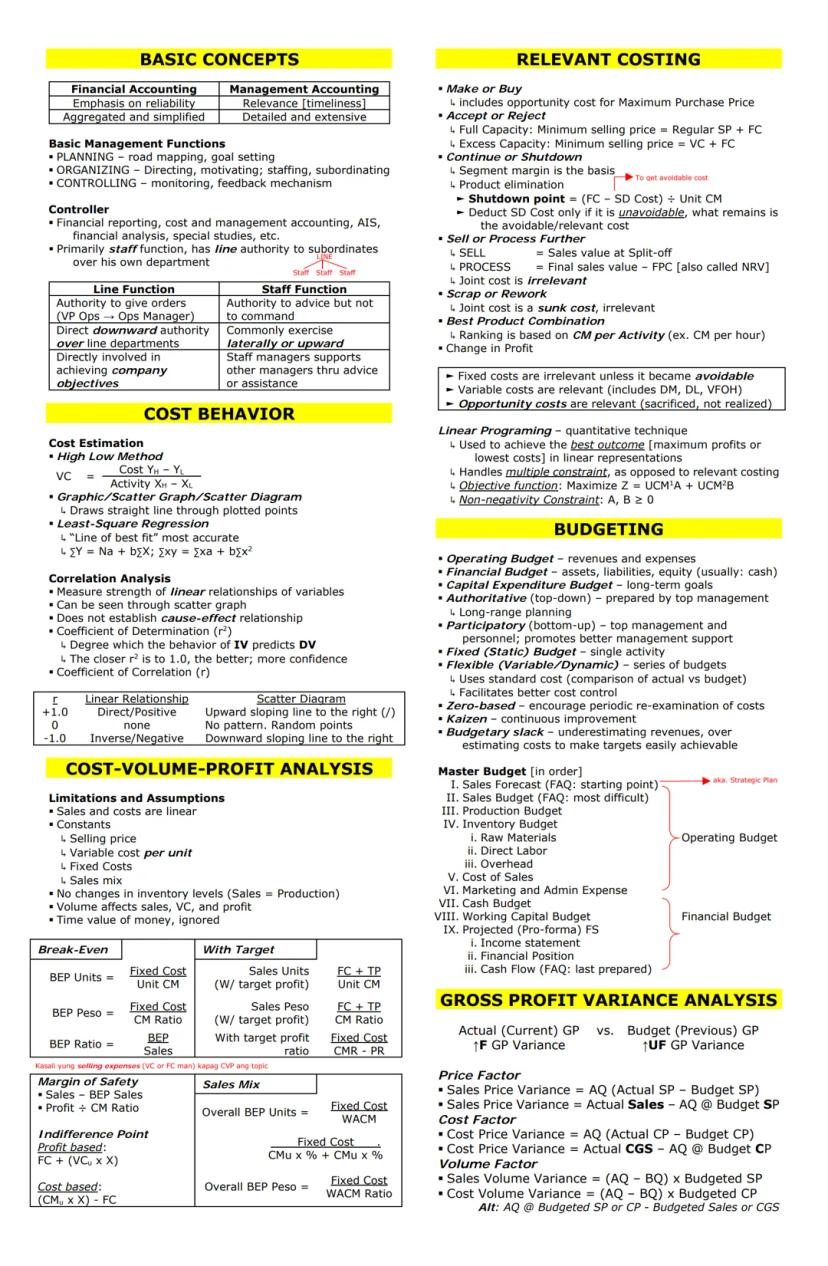
Financial accounting focuses on reliability and creates aggregated reports, while management accounting prioritizes relevance with detailed information for internal decision-making. In organizations, the controller handles financial reporting, cost accounting, and financial analysis, serving primarily as a staff function (advising rather than commanding).
Understanding cost behavior is crucial for business decisions. When analyzing costs, several methods help determine how costs change with activity:
- High-Low Method calculates variable costs using highest and lowest activity points
- Scatter Diagrams visually represent cost relationships
- Least-Square Regression creates the most accurate "line of best fit"
💡 The coefficient of determination (r²) tells you how well one variable predicts another. The closer to 1.0, the stronger the relationship!
Cost-Volume-Profit (CVP) analysis examines relationships between costs, volume, and profits. The break-even point shows where total revenue equals total costs (zero profit). Key formulas include:
- Break-even in units = Fixed Cost ÷ Unit Contribution Margin
- Break-even in pesos = Fixed Cost ÷ CM Ratio
- Margin of Safety = Sales - Break-even Sales
When making decisions using relevant costing, focus only on costs that differ between alternatives. Remember that fixed costs are typically irrelevant unless avoidable, while variable costs and opportunity costs (what you give up) are relevant.
Budgeting
A master budget is an organization's comprehensive financial plan. It starts with a sales forecast (the most difficult part) and includes production, inventory, expense, and cash budgets, ultimately creating projected financial statements.
Operating budgets cover revenues and expenses, while financial budgets deal with assets, liabilities, and equity. Budget approaches include:
- Authoritative prepared by management
- Participatory involves staff input
- Zero-based requires justifying all expenses periodically
Variance analysis compares actual results with budgeted figures. A favorable gross profit variance means actual profit exceeded budget, while an unfavorable variance indicates underperformance.
2
of 6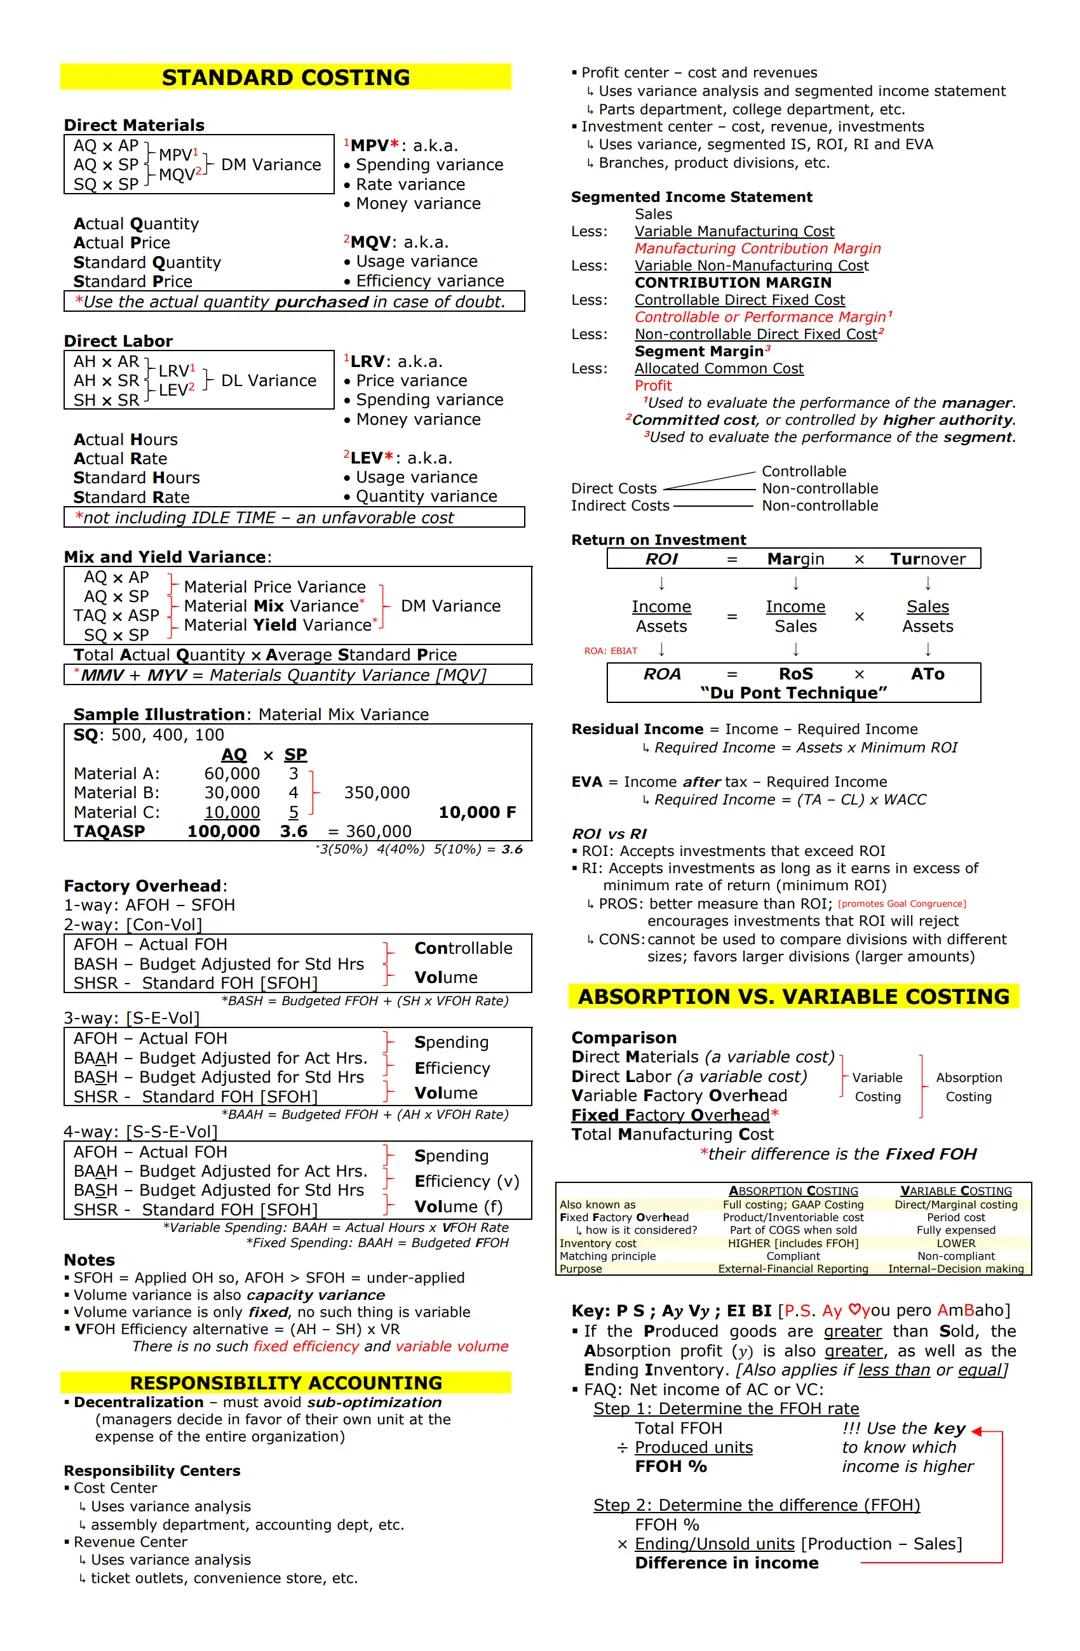
Standard Costing and Responsibility Centers
Standard costing establishes predetermined costs for products and services, allowing companies to analyze deviations. When actual results differ from standards, companies calculate variances to understand why.
For direct materials, key variances include:
- Material Price Variance (MPV): difference between actual and standard prices
- Material Quantity Variance (MQV): difference between actual and standard quantities used
For direct labor:
- Labor Rate Variance (LRV): difference between actual and standard wage rates
- Labor Efficiency Variance (LEV): difference between actual and standard hours worked
💡 Variance analysis helps managers identify problems quickly. A favorable variance isn't always good—it might mean your standards were set too loosely!
In responsibility accounting, organizations divide into centers based on controllable factors:
- Cost Centers: responsible for costs only (like assembly departments)
- Revenue Centers: responsible for revenue generation (like sales departments)
- Profit Centers: responsible for both costs and revenues
- Investment Centers: responsible for costs, revenues, and investments
The segmented income statement separates controllable and non-controllable costs to evaluate both manager performance and segment profitability:
- Sales
- Less: Variable Manufacturing Cost
- Manufacturing Contribution Margin
- Less: Variable Non-Manufacturing Cost
- Contribution Margin
- Less: Controllable Direct Fixed Cost
- Controllable Margin (evaluates manager performance)
- Less: Non-controllable Direct Fixed Cost
- Segment Margin (evaluates segment performance)
- Less: Allocated Common Cost
- Profit
Investment centers use performance measures including:
- Return on Investment (ROI) = Income ÷ Assets
- Can be broken down as (Income ÷ Sales) × (Sales ÷ Assets)
- Residual Income (RI) = Income - Required Income
- Better than ROI for encouraging profitable investments
- Economic Value Added (EVA) = Income after tax - Required Income
3
of 6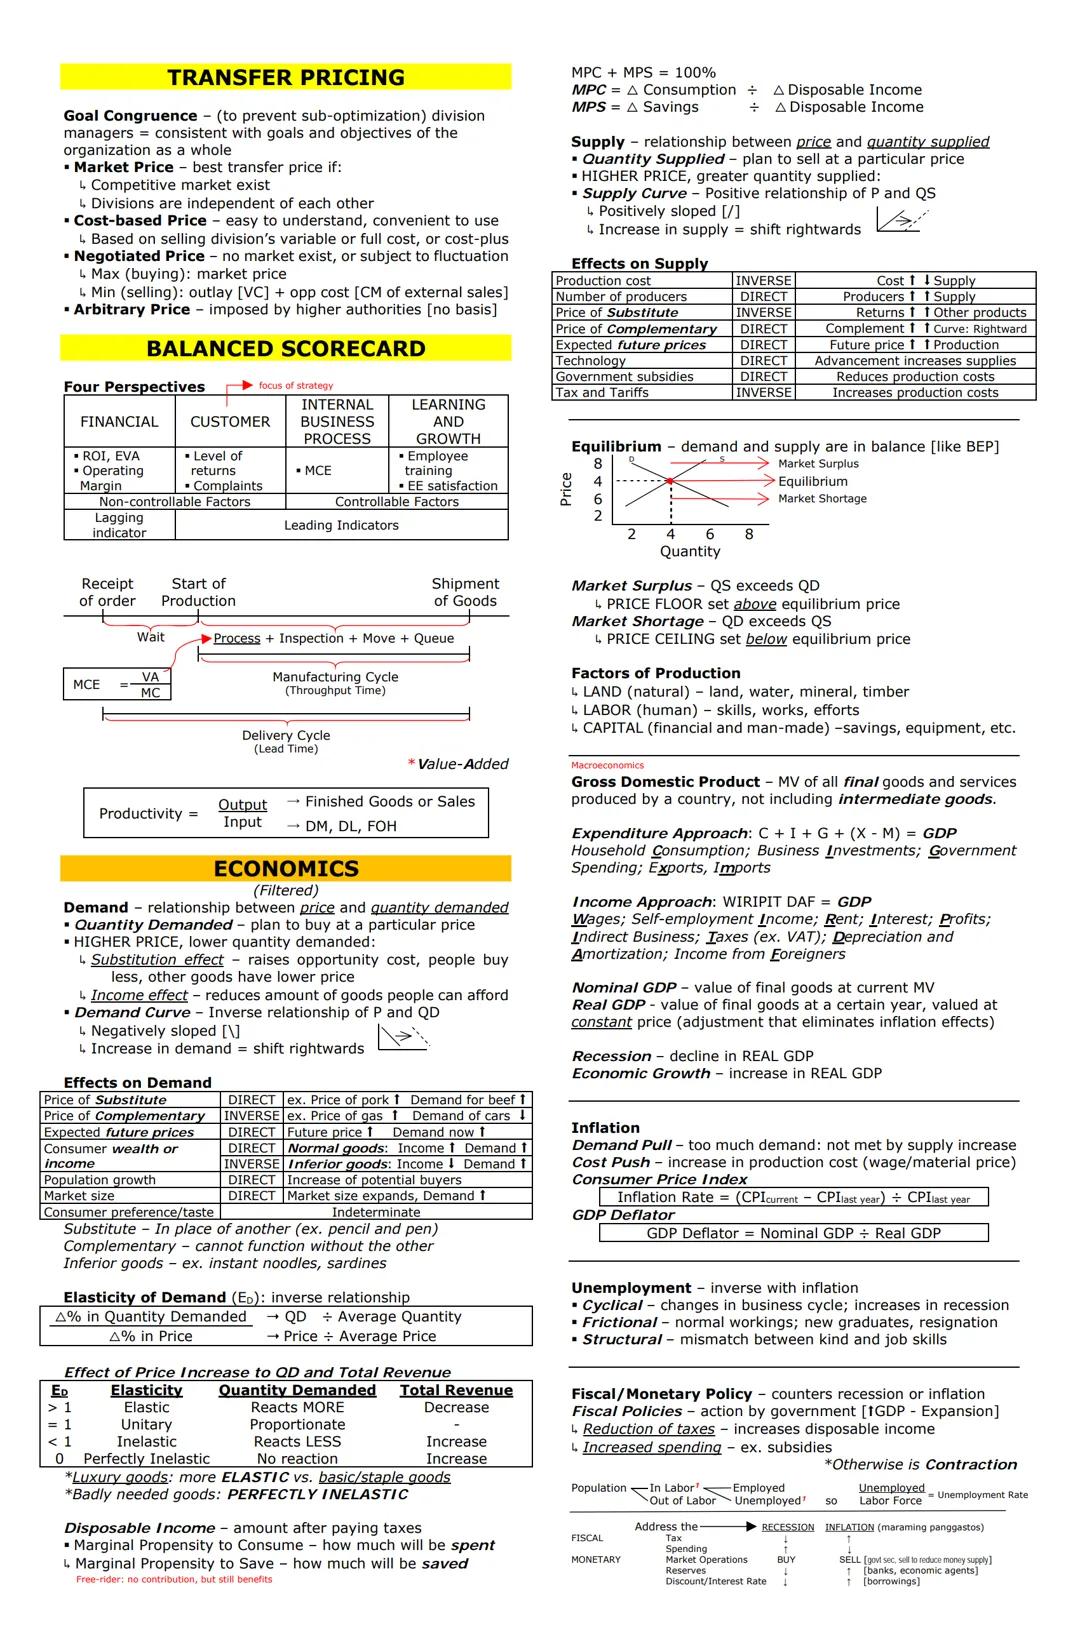
Transfer Pricing, Balanced Scorecard, and Economics
Transfer pricing determines values for products and services exchanged between divisions of the same company. The best transfer pricing systems promote goal congruence—ensuring division managers' decisions align with overall company objectives. Options include:
- Market Price: best when competitive markets exist and divisions operate independently
- Cost-based Price: based on the selling division's variable or full costs
- Negotiated Price: used when no market exists or prices fluctuate significantly
- Arbitrary Price: imposed by higher management with no clear basis
The Balanced Scorecard provides a comprehensive view of organizational performance through four perspectives:
- Financial: ROI, EVA, operating margin
- Customer: customer satisfaction, returns, complaints
- Internal Business Process: manufacturing cycle efficiency
- Learning and Growth: employee training and satisfaction
💡 Financial measures are "lagging indicators" showing past performance, while the other three perspectives are "leading indicators" that predict future financial performance!
In economics, understanding supply and demand is fundamental. The demand curve shows an inverse relationship between price and quantity demanded—as price increases, quantity demanded decreases. Factors affecting demand include:
- Price of substitutes (direct relationship)
- Price of complements (inverse relationship)
- Consumer income (direct for normal goods, inverse for inferior goods)
- Consumer preferences and population size
The elasticity of demand measures how sensitive quantity demanded is to price changes:
- Elastic demand (E>1): quantity changes more than price
- Inelastic demand (E<1): quantity changes less than price
- Unitary elastic : quantity and price change proportionally
Supply curves show a positive relationship—as price increases, quantity supplied increases. Key economic measurements include:
- GDP (Gross Domestic Product): total value of final goods and services
- Inflation: increase in general price level (measured by CPI or GDP Deflator)
- Unemployment: categorized as cyclical, frictional, or structural
4
of 6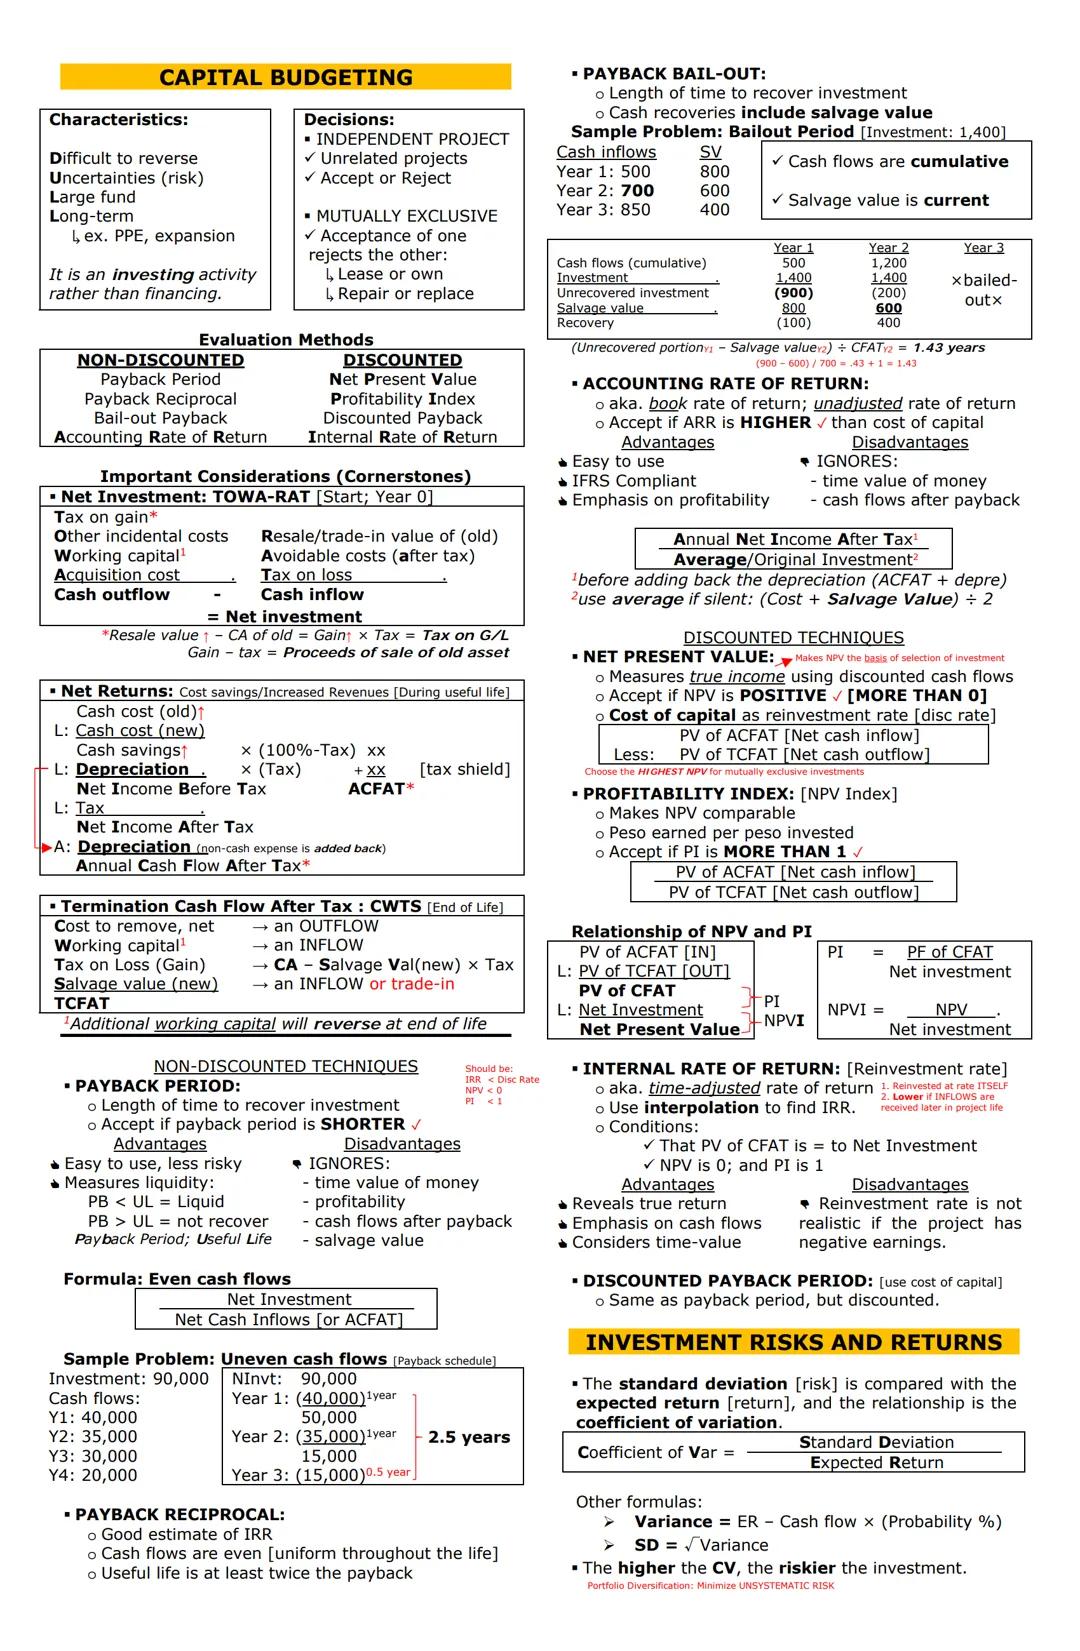
Capital Budgeting and Investment Analysis
Capital budgeting involves evaluating long-term investments like purchasing equipment or expanding facilities. These decisions are typically:
- Difficult to reverse
- Involve significant uncertainty
- Require large funding
- Have long-term implications
When analyzing projects, consider these key elements:
- Net Investment (initial cash outflow)
- Annual Cash Flow After Tax (ACFAT)
- Termination Cash Flow (at project end)
Capital budgeting techniques fall into two categories:
Non-Discounted Methods (ignore time value of money):
- Payback Period: time required to recover the investment
- Accounting Rate of Return: average annual income ÷ investment
Discounted Methods (account for time value of money):
- Net Present Value (NPV): present value of all cash flows
- Profitability Index (PI): ratio of present value of inflows to outflows
- Internal Rate of Return (IRR): discount rate that makes NPV equal zero
- Discounted Payback Period: time to recover investment in present value terms
💡 For comparing projects, NPV is generally the most reliable method because it directly measures value added to the company!
When evaluating project types:
- Independent projects: Accept if NPV > 0, PI > 1, or IRR > discount rate
- Mutually exclusive projects: Choose the one with highest NPV
Investment risk analysis evaluates uncertainty in future cash flows:
- Standard deviation measures risk (variability)
- Expected return measures potential reward
- Coefficient of variation (standard deviation ÷ expected return) helps compare investments with different risks and returns
Remember that diversification can reduce unsystematic risk but not systematic risk .
5
of 6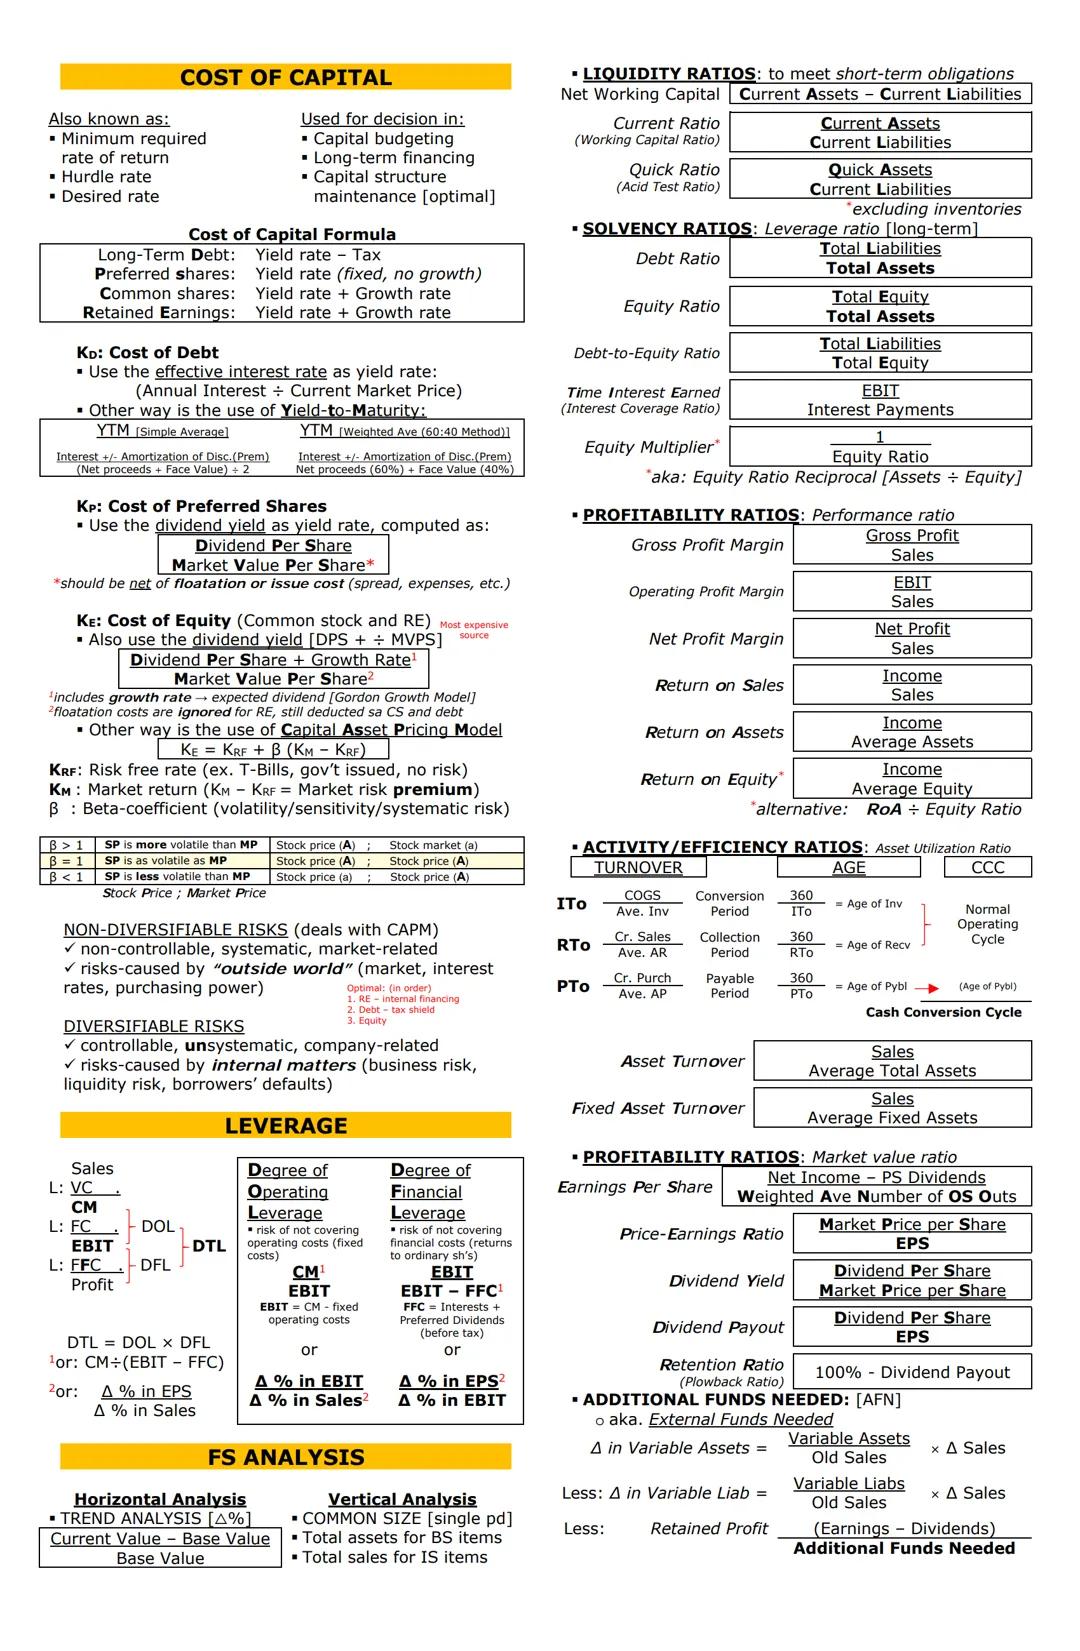
Cost of Capital and Financial Statement Analysis
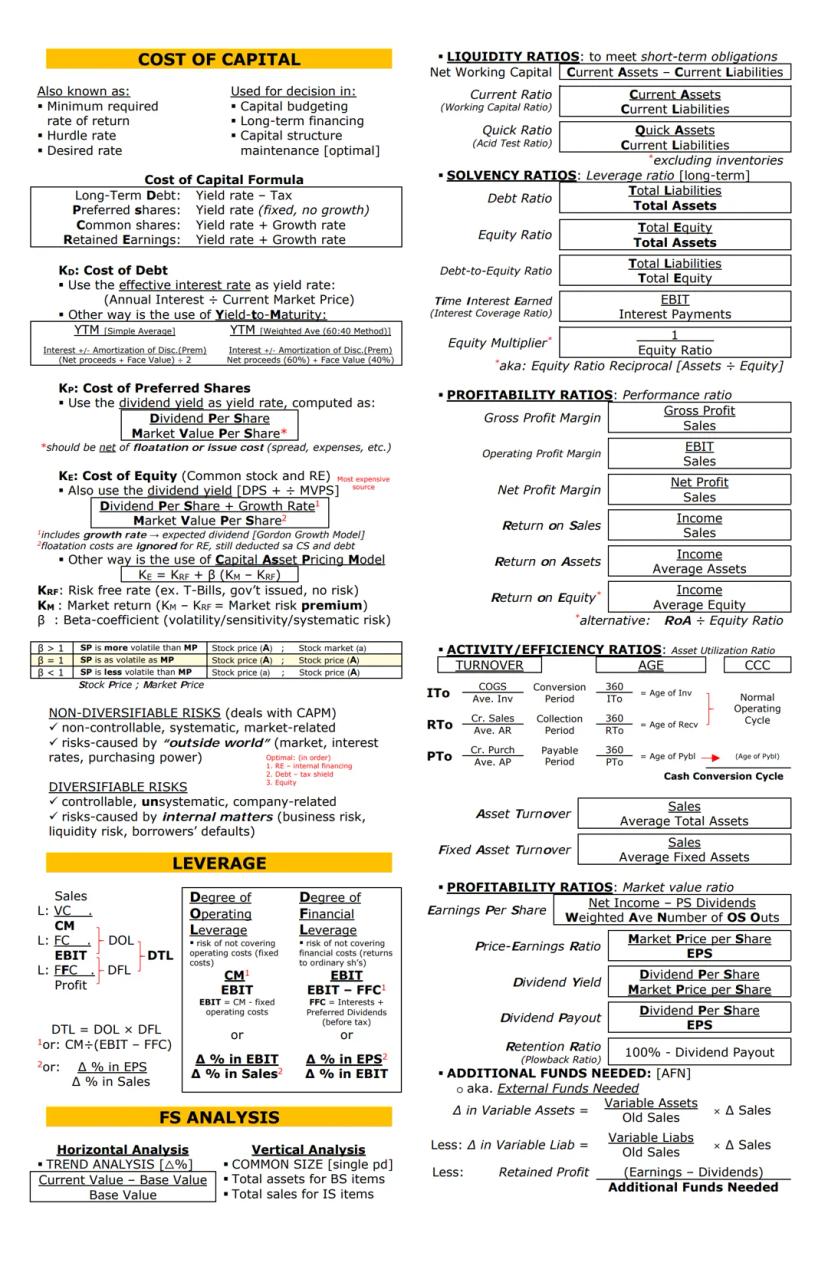
The cost of capital represents the minimum return required on investments. It's used for capital budgeting decisions and maintaining optimal capital structure. Components include:
-
Cost of Debt (KD): interest rate adjusted for tax benefits
- KD = Yield rate ×
- Usually the cheapest source due to tax deductibility
-
Cost of Preferred Stock (KP): dividend yield
- KP = Preferred dividend ÷ Market price
-
Cost of Equity (KE): return required by shareholders
- Dividend Growth Model: KE = (Dividend ÷ Price) + Growth rate
- Capital Asset Pricing Model: KE = Risk-free rate + β
- Most expensive source of capital
A company's beta coefficient (β) measures a stock's volatility relative to the market:
- β > 1: more volatile than market
- β = 1: same volatility as market
- β < 1: less volatile than market
Financial leverage affects risk and return. Key metrics include:
- Degree of Operating Leverage (DOL): Contribution Margin ÷ EBIT
- Degree of Financial Leverage (DFL): EBIT ÷
- Degree of Total Leverage (DTL): DOL × DFL
💡 Higher leverage magnifies both profits and losses. When sales increase by 10%, a company with a DTL of 3 will see profits increase by 30%!
Financial statement analysis provides insights into company performance:
- Horizontal Analysis: compares figures across time periods
- Vertical Analysis: expresses items as percentages of a base figure
Key financial ratios include:
- Liquidity Ratios: Current Ratio, Quick Ratio
- Solvency Ratios: Debt Ratio, Interest Coverage Ratio
- Profitability Ratios: Gross Profit Margin, Return on Assets, Return on Equity
- Activity Ratios: Inventory Turnover, Accounts Receivable Turnover
- Market Value Ratios: Earnings Per Share, Price-Earnings Ratio
The Cash Conversion Cycle measures the time between paying for inventory and collecting from customers: CCC = Inventory Conversion Period + Collection Period - Payable Period
6
of 6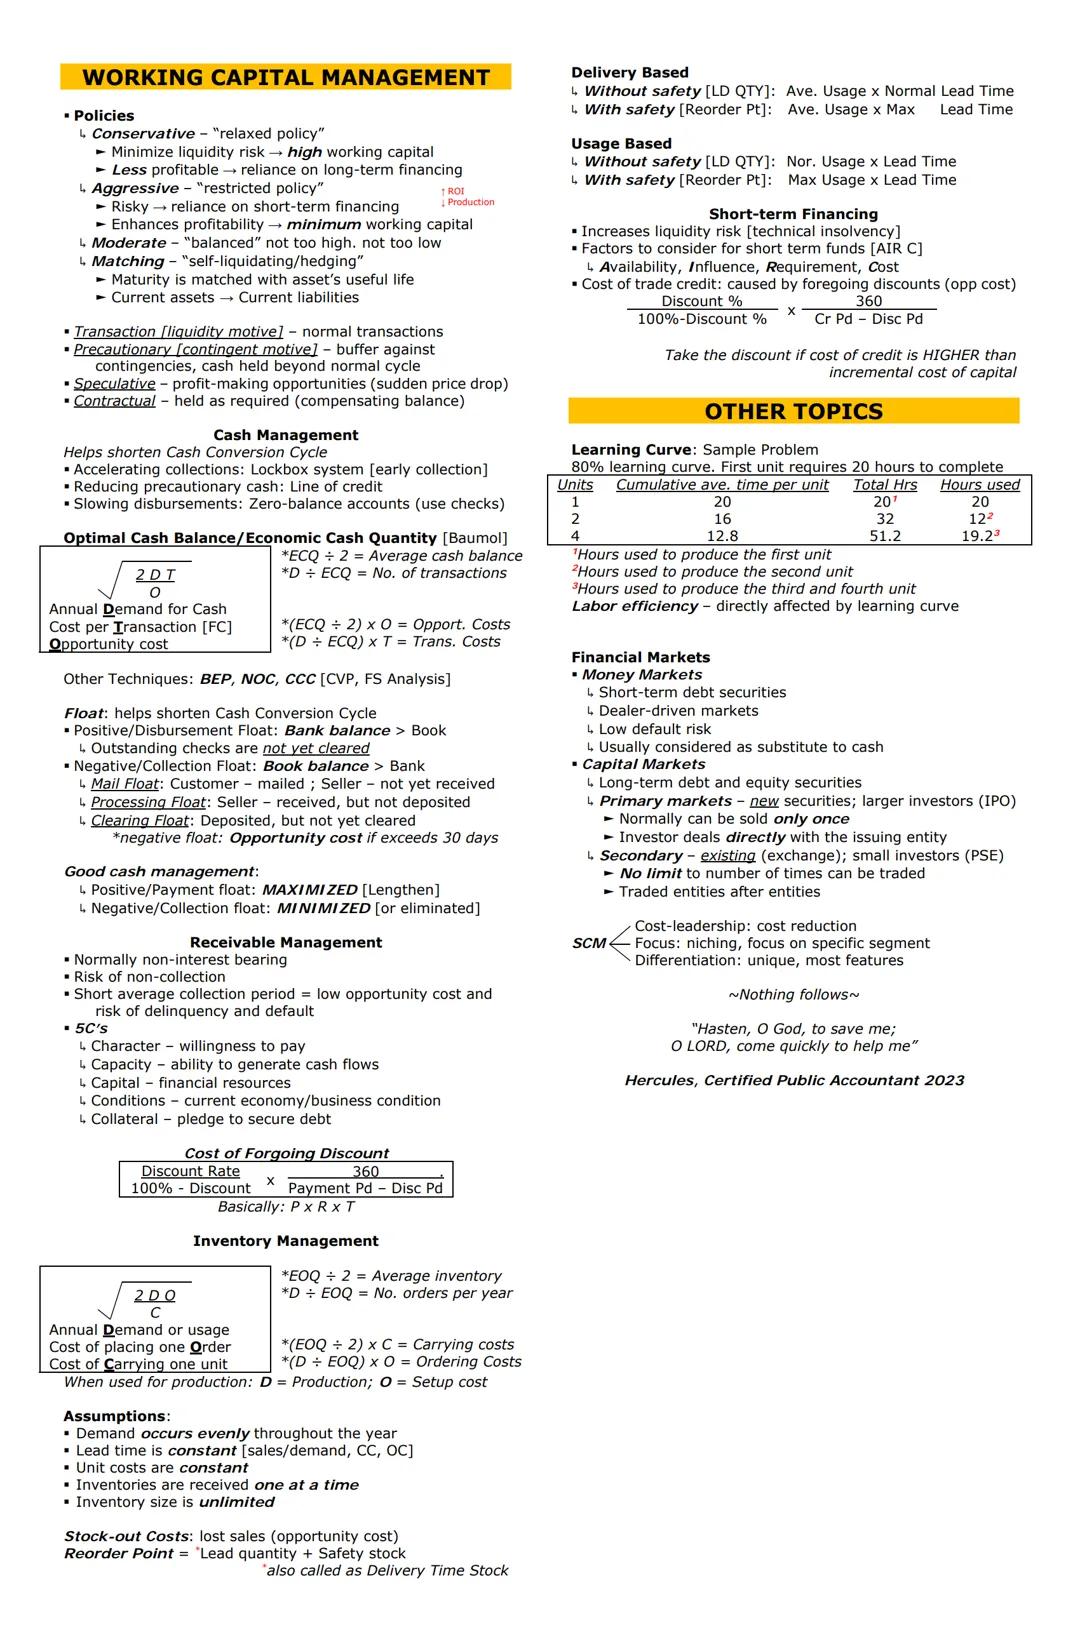
Working Capital Management and Financial Markets
Working capital management involves optimizing current assets and liabilities. Companies can adopt different strategies:
- Conservative Policy: High working capital, lower risk, less profitable
- Aggressive Policy: Minimal working capital, higher risk, more profitable
- Moderate Policy: Balanced approach
- Matching Policy: Aligning financing duration with asset life
Cash is held for four primary reasons:
- Transaction motive: for normal operations
- Precautionary motive: as a buffer against uncertainties
- Speculative motive: to capitalize on opportunities
- Contractual motive: to meet requirements like compensating balances
Cash management techniques help optimize cash flows:
- Using lockbox systems to accelerate collections
- Establishing lines of credit to reduce precautionary cash
- Implementing zero-balance accounts to slow disbursements
- Calculating optimal cash balances using the Baumol model
💡 The Cash Conversion Cycle can be shortened by accelerating collections, optimizing inventory, and extending (without defaulting on) payables!
For inventory management, the Economic Order Quantity (EOQ) model helps determine optimal order sizes by balancing ordering and carrying costs:
EOQ = √ where:
- D = Annual demand
- O = Cost per order
- C = Annual carrying cost per unit
When financing working capital, companies can use:
- Trade credit (accounts payable)
- Short-term loans
- Lines of credit
In the broader financial landscape, companies interact with:
- Money Markets: for short-term financing (typically under one year)
- Capital Markets: for long-term financing through debt and equity
- Primary Markets: where new securities are issued (like IPOs)
- Secondary Markets: where existing securities are traded (like stock exchanges)
Competitive strategies include:
- Cost leadership: minimizing costs
- Differentiation: creating unique products/services
- Focus strategy: targeting specific market segments
We thought you’d never ask...
What is the Knowunity AI companion?
Our AI companion is specifically built for the needs of students. Based on the millions of content pieces we have on the platform we can provide truly meaningful and relevant answers to students. But its not only about answers, the companion is even more about guiding students through their daily learning challenges, with personalised study plans, quizzes or content pieces in the chat and 100% personalisation based on the students skills and developments.
Where can I download the Knowunity app?
You can download the app in the Google Play Store and in the Apple App Store.
Is Knowunity really free of charge?
That's right! Enjoy free access to study content, connect with fellow students, and get instant help – all at your fingertips.
Most popular content in Algebra
9FAR NOTES- CPM
Compiled by CPM
College2,04346
AFAR NOTES- CPM
Compiled by CPM
College1,27917
TAX NOTES - CPM
COMPILED BY CPM
College1,01620
RFBT NOTES - KUYA WOWOWIE
Rfbt notes by Kuya Wowowie
College6112
FAR NOTES-HERCULES
LAST MINUTE NOTES BY HERCULES CPA
College1,12818
MS NOTES-CPM
Compiled by CPM
College69513
FAR NOTES - KUYA WOWOWIE
Far notes by Kuya Wowowie
College85917
RFBT NOTES- HERCULES
LAST MINUTE NOTES BY HERCULES CPA
College88715
AT NOTES-CPM
Compiled by CPM
College49910
Most popular content
9O
Origins and Dynamics of the Columbian Exchange
Analyze the ecological and economic motivations behind the initial transfer of goods, people, and diseases between the Old and New Worlds.
9th3,1280
I
Introduction to Early Cultural Interactions
Analyze the initial social and religious encounters between Europeans, Africans, and Indigenous peoples in the colonial Americas.
9th2,7730
O
Origins of Ancient River Civilizations
Analyze the environmental factors and technological innovations that led to the rise of early states in Mesopotamia, Egypt, and the Indus Valley.
9th3,1870
M
Motivations for European Exploration
Analyze the economic, religious, and political factors that drove European powers to the Americas during the 15th and 16th centuries.
9th1,7780
F
Foundations of Ethical Guidelines in Research
Practice the core principles of the APA ethical code including informed consent, debriefing, and the role of Institutional Review Boards.
9th1,3360
I
Introduction to Native American Societies
Examine the diverse social, political, and economic structures of North American indigenous groups prior to European contact.
9th1,1100
I
Introduction to Biological Elements of Life
Practice identifying the essential elements including carbon, nitrogen, phosphorus, and sulfur that compose biological macromolecules.
9th1,7410
I
Introduction to the Spanish Encomienda System
Explore the fundamental economic and social structures of the Spanish colonial system, focusing on the encomienda and the casta social hierarchy.
9th8890
O
Origins and Continuity of the Byzantine Empire
Analyze the political and cultural transitions from the Roman Empire to the Byzantine Empire, focusing on the reign of Justinian I and his code.
9th1,6320
Can't find what you're looking for? Explore other subjects.
Students love us — and so will you.
4.6/5App Store
4.7/5Google Play
The app is very easy to use and well designed. I have found everything I was looking for so far and have been able to learn a lot from the presentations! I will definitely use the app for a class assignment! And of course it also helps a lot as an inspiration.
Stefan SiOS user
This app is really great. There are so many study notes and help [...]. My problem subject is French, for example, and the app has so many options for help. Thanks to this app, I have improved my French. I would recommend it to anyone.
Samantha KlichAndroid user
Wow, I am really amazed. I just tried the app because I've seen it advertised many times and was absolutely stunned. This app is THE HELP you want for school and above all, it offers so many things, such as workouts and fact sheets, which have been VERY helpful to me personally.
AnnaiOS user
Hercules CPA - MS Notes for Last Minute Prep
studywithnessa@studywithnessa
Welcome to your crash course in accounting and finance fundamentals! This guide covers essential concepts from financial and management accounting to capital budgeting, cost analysis, and economic principles. Whether you're preparing for exams or building business knowledge, these key concepts...
1
of 6
Sign up to see the content. It's free!
- Access to all documents
- Improve your grades
- Join milions of students
Basic Concepts and Cost Behavior
Financial accounting focuses on reliability and creates aggregated reports, while management accounting prioritizes relevance with detailed information for internal decision-making. In organizations, the controller handles financial reporting, cost accounting, and financial analysis, serving primarily as a staff function (advising rather than commanding).
Understanding cost behavior is crucial for business decisions. When analyzing costs, several methods help determine how costs change with activity:
- High-Low Method calculates variable costs using highest and lowest activity points
- Scatter Diagrams visually represent cost relationships
- Least-Square Regression creates the most accurate "line of best fit"
💡 The coefficient of determination (r²) tells you how well one variable predicts another. The closer to 1.0, the stronger the relationship!
Cost-Volume-Profit (CVP) analysis examines relationships between costs, volume, and profits. The break-even point shows where total revenue equals total costs (zero profit). Key formulas include:
- Break-even in units = Fixed Cost ÷ Unit Contribution Margin
- Break-even in pesos = Fixed Cost ÷ CM Ratio
- Margin of Safety = Sales - Break-even Sales
When making decisions using relevant costing, focus only on costs that differ between alternatives. Remember that fixed costs are typically irrelevant unless avoidable, while variable costs and opportunity costs (what you give up) are relevant.
Budgeting
A master budget is an organization's comprehensive financial plan. It starts with a sales forecast (the most difficult part) and includes production, inventory, expense, and cash budgets, ultimately creating projected financial statements.
Operating budgets cover revenues and expenses, while financial budgets deal with assets, liabilities, and equity. Budget approaches include:
- Authoritative prepared by management
- Participatory involves staff input
- Zero-based requires justifying all expenses periodically
Variance analysis compares actual results with budgeted figures. A favorable gross profit variance means actual profit exceeded budget, while an unfavorable variance indicates underperformance.
2
of 6Sign up to see the content. It's free!
- Access to all documents
- Improve your grades
- Join milions of students
Standard Costing and Responsibility Centers
Standard costing establishes predetermined costs for products and services, allowing companies to analyze deviations. When actual results differ from standards, companies calculate variances to understand why.
For direct materials, key variances include:
- Material Price Variance (MPV): difference between actual and standard prices
- Material Quantity Variance (MQV): difference between actual and standard quantities used
For direct labor:
- Labor Rate Variance (LRV): difference between actual and standard wage rates
- Labor Efficiency Variance (LEV): difference between actual and standard hours worked
💡 Variance analysis helps managers identify problems quickly. A favorable variance isn't always good—it might mean your standards were set too loosely!
In responsibility accounting, organizations divide into centers based on controllable factors:
- Cost Centers: responsible for costs only (like assembly departments)
- Revenue Centers: responsible for revenue generation (like sales departments)
- Profit Centers: responsible for both costs and revenues
- Investment Centers: responsible for costs, revenues, and investments
The segmented income statement separates controllable and non-controllable costs to evaluate both manager performance and segment profitability:
- Sales
- Less: Variable Manufacturing Cost
- Manufacturing Contribution Margin
- Less: Variable Non-Manufacturing Cost
- Contribution Margin
- Less: Controllable Direct Fixed Cost
- Controllable Margin (evaluates manager performance)
- Less: Non-controllable Direct Fixed Cost
- Segment Margin (evaluates segment performance)
- Less: Allocated Common Cost
- Profit
Investment centers use performance measures including:
- Return on Investment (ROI) = Income ÷ Assets
- Can be broken down as (Income ÷ Sales) × (Sales ÷ Assets)
- Residual Income (RI) = Income - Required Income
- Better than ROI for encouraging profitable investments
- Economic Value Added (EVA) = Income after tax - Required Income
3
of 6Sign up to see the content. It's free!
- Access to all documents
- Improve your grades
- Join milions of students
Transfer Pricing, Balanced Scorecard, and Economics
Transfer pricing determines values for products and services exchanged between divisions of the same company. The best transfer pricing systems promote goal congruence—ensuring division managers' decisions align with overall company objectives. Options include:
- Market Price: best when competitive markets exist and divisions operate independently
- Cost-based Price: based on the selling division's variable or full costs
- Negotiated Price: used when no market exists or prices fluctuate significantly
- Arbitrary Price: imposed by higher management with no clear basis
The Balanced Scorecard provides a comprehensive view of organizational performance through four perspectives:
- Financial: ROI, EVA, operating margin
- Customer: customer satisfaction, returns, complaints
- Internal Business Process: manufacturing cycle efficiency
- Learning and Growth: employee training and satisfaction
💡 Financial measures are "lagging indicators" showing past performance, while the other three perspectives are "leading indicators" that predict future financial performance!
In economics, understanding supply and demand is fundamental. The demand curve shows an inverse relationship between price and quantity demanded—as price increases, quantity demanded decreases. Factors affecting demand include:
- Price of substitutes (direct relationship)
- Price of complements (inverse relationship)
- Consumer income (direct for normal goods, inverse for inferior goods)
- Consumer preferences and population size
The elasticity of demand measures how sensitive quantity demanded is to price changes:
- Elastic demand (E>1): quantity changes more than price
- Inelastic demand (E<1): quantity changes less than price
- Unitary elastic : quantity and price change proportionally
Supply curves show a positive relationship—as price increases, quantity supplied increases. Key economic measurements include:
- GDP (Gross Domestic Product): total value of final goods and services
- Inflation: increase in general price level (measured by CPI or GDP Deflator)
- Unemployment: categorized as cyclical, frictional, or structural
4
of 6Sign up to see the content. It's free!
- Access to all documents
- Improve your grades
- Join milions of students
Capital Budgeting and Investment Analysis
Capital budgeting involves evaluating long-term investments like purchasing equipment or expanding facilities. These decisions are typically:
- Difficult to reverse
- Involve significant uncertainty
- Require large funding
- Have long-term implications
When analyzing projects, consider these key elements:
- Net Investment (initial cash outflow)
- Annual Cash Flow After Tax (ACFAT)
- Termination Cash Flow (at project end)
Capital budgeting techniques fall into two categories:
Non-Discounted Methods (ignore time value of money):
- Payback Period: time required to recover the investment
- Accounting Rate of Return: average annual income ÷ investment
Discounted Methods (account for time value of money):
- Net Present Value (NPV): present value of all cash flows
- Profitability Index (PI): ratio of present value of inflows to outflows
- Internal Rate of Return (IRR): discount rate that makes NPV equal zero
- Discounted Payback Period: time to recover investment in present value terms
💡 For comparing projects, NPV is generally the most reliable method because it directly measures value added to the company!
When evaluating project types:
- Independent projects: Accept if NPV > 0, PI > 1, or IRR > discount rate
- Mutually exclusive projects: Choose the one with highest NPV
Investment risk analysis evaluates uncertainty in future cash flows:
- Standard deviation measures risk (variability)
- Expected return measures potential reward
- Coefficient of variation (standard deviation ÷ expected return) helps compare investments with different risks and returns
Remember that diversification can reduce unsystematic risk but not systematic risk .
5
of 6Sign up to see the content. It's free!
- Access to all documents
- Improve your grades
- Join milions of students
Cost of Capital and Financial Statement Analysis
The cost of capital represents the minimum return required on investments. It's used for capital budgeting decisions and maintaining optimal capital structure. Components include:
-
Cost of Debt (KD): interest rate adjusted for tax benefits
- KD = Yield rate ×
- Usually the cheapest source due to tax deductibility
-
Cost of Preferred Stock (KP): dividend yield
- KP = Preferred dividend ÷ Market price
-
Cost of Equity (KE): return required by shareholders
- Dividend Growth Model: KE = (Dividend ÷ Price) + Growth rate
- Capital Asset Pricing Model: KE = Risk-free rate + β
- Most expensive source of capital
A company's beta coefficient (β) measures a stock's volatility relative to the market:
- β > 1: more volatile than market
- β = 1: same volatility as market
- β < 1: less volatile than market
Financial leverage affects risk and return. Key metrics include:
- Degree of Operating Leverage (DOL): Contribution Margin ÷ EBIT
- Degree of Financial Leverage (DFL): EBIT ÷
- Degree of Total Leverage (DTL): DOL × DFL
💡 Higher leverage magnifies both profits and losses. When sales increase by 10%, a company with a DTL of 3 will see profits increase by 30%!
Financial statement analysis provides insights into company performance:
- Horizontal Analysis: compares figures across time periods
- Vertical Analysis: expresses items as percentages of a base figure
Key financial ratios include:
- Liquidity Ratios: Current Ratio, Quick Ratio
- Solvency Ratios: Debt Ratio, Interest Coverage Ratio
- Profitability Ratios: Gross Profit Margin, Return on Assets, Return on Equity
- Activity Ratios: Inventory Turnover, Accounts Receivable Turnover
- Market Value Ratios: Earnings Per Share, Price-Earnings Ratio
The Cash Conversion Cycle measures the time between paying for inventory and collecting from customers: CCC = Inventory Conversion Period + Collection Period - Payable Period
6
of 6Sign up to see the content. It's free!
- Access to all documents
- Improve your grades
- Join milions of students
Working Capital Management and Financial Markets
Working capital management involves optimizing current assets and liabilities. Companies can adopt different strategies:
- Conservative Policy: High working capital, lower risk, less profitable
- Aggressive Policy: Minimal working capital, higher risk, more profitable
- Moderate Policy: Balanced approach
- Matching Policy: Aligning financing duration with asset life
Cash is held for four primary reasons:
- Transaction motive: for normal operations
- Precautionary motive: as a buffer against uncertainties
- Speculative motive: to capitalize on opportunities
- Contractual motive: to meet requirements like compensating balances
Cash management techniques help optimize cash flows:
- Using lockbox systems to accelerate collections
- Establishing lines of credit to reduce precautionary cash
- Implementing zero-balance accounts to slow disbursements
- Calculating optimal cash balances using the Baumol model
💡 The Cash Conversion Cycle can be shortened by accelerating collections, optimizing inventory, and extending (without defaulting on) payables!
For inventory management, the Economic Order Quantity (EOQ) model helps determine optimal order sizes by balancing ordering and carrying costs:
EOQ = √ where:
- D = Annual demand
- O = Cost per order
- C = Annual carrying cost per unit
When financing working capital, companies can use:
- Trade credit (accounts payable)
- Short-term loans
- Lines of credit
In the broader financial landscape, companies interact with:
- Money Markets: for short-term financing (typically under one year)
- Capital Markets: for long-term financing through debt and equity
- Primary Markets: where new securities are issued (like IPOs)
- Secondary Markets: where existing securities are traded (like stock exchanges)
Competitive strategies include:
- Cost leadership: minimizing costs
- Differentiation: creating unique products/services
- Focus strategy: targeting specific market segments
We thought you’d never ask...
What is the Knowunity AI companion?
Our AI companion is specifically built for the needs of students. Based on the millions of content pieces we have on the platform we can provide truly meaningful and relevant answers to students. But its not only about answers, the companion is even more about guiding students through their daily learning challenges, with personalised study plans, quizzes or content pieces in the chat and 100% personalisation based on the students skills and developments.
Where can I download the Knowunity app?
You can download the app in the Google Play Store and in the Apple App Store.
Is Knowunity really free of charge?
That's right! Enjoy free access to study content, connect with fellow students, and get instant help – all at your fingertips.
Most popular content in Algebra
9FAR NOTES- CPM
Compiled by CPM
College2,04346
AFAR NOTES- CPM
Compiled by CPM
College1,27917
TAX NOTES - CPM
COMPILED BY CPM
College1,01620
RFBT NOTES - KUYA WOWOWIE
Rfbt notes by Kuya Wowowie
College6112
FAR NOTES-HERCULES
LAST MINUTE NOTES BY HERCULES CPA
College1,12818
MS NOTES-CPM
Compiled by CPM
College69513
FAR NOTES - KUYA WOWOWIE
Far notes by Kuya Wowowie
College85917
RFBT NOTES- HERCULES
LAST MINUTE NOTES BY HERCULES CPA
College88715
AT NOTES-CPM
Compiled by CPM
College49910
Most popular content
9O
Origins and Dynamics of the Columbian Exchange
Analyze the ecological and economic motivations behind the initial transfer of goods, people, and diseases between the Old and New Worlds.
9th3,1280
I
Introduction to Early Cultural Interactions
Analyze the initial social and religious encounters between Europeans, Africans, and Indigenous peoples in the colonial Americas.
9th2,7730
O
Origins of Ancient River Civilizations
Analyze the environmental factors and technological innovations that led to the rise of early states in Mesopotamia, Egypt, and the Indus Valley.
9th3,1870
M
Motivations for European Exploration
Analyze the economic, religious, and political factors that drove European powers to the Americas during the 15th and 16th centuries.
9th1,7780
F
Foundations of Ethical Guidelines in Research
Practice the core principles of the APA ethical code including informed consent, debriefing, and the role of Institutional Review Boards.
9th1,3360
I
Introduction to Native American Societies
Examine the diverse social, political, and economic structures of North American indigenous groups prior to European contact.
9th1,1100
I
Introduction to Biological Elements of Life
Practice identifying the essential elements including carbon, nitrogen, phosphorus, and sulfur that compose biological macromolecules.
9th1,7410
I
Introduction to the Spanish Encomienda System
Explore the fundamental economic and social structures of the Spanish colonial system, focusing on the encomienda and the casta social hierarchy.
9th8890
O
Origins and Continuity of the Byzantine Empire
Analyze the political and cultural transitions from the Roman Empire to the Byzantine Empire, focusing on the reign of Justinian I and his code.
9th1,6320
Can't find what you're looking for? Explore other subjects.
Students love us — and so will you.
4.6/5App Store
4.7/5Google Play
The app is very easy to use and well designed. I have found everything I was looking for so far and have been able to learn a lot from the presentations! I will definitely use the app for a class assignment! And of course it also helps a lot as an inspiration.
Stefan SiOS user
This app is really great. There are so many study notes and help [...]. My problem subject is French, for example, and the app has so many options for help. Thanks to this app, I have improved my French. I would recommend it to anyone.
Samantha KlichAndroid user
Wow, I am really amazed. I just tried the app because I've seen it advertised many times and was absolutely stunned. This app is THE HELP you want for school and above all, it offers so many things, such as workouts and fact sheets, which have been VERY helpful to me personally.
AnnaiOS user