Welcome to Unit 2 of your AP Human Geography course!...
APHG Unit 2 Study Notes
H
Harkiran@xoxo.harkiran


1 / 10
1
of 10
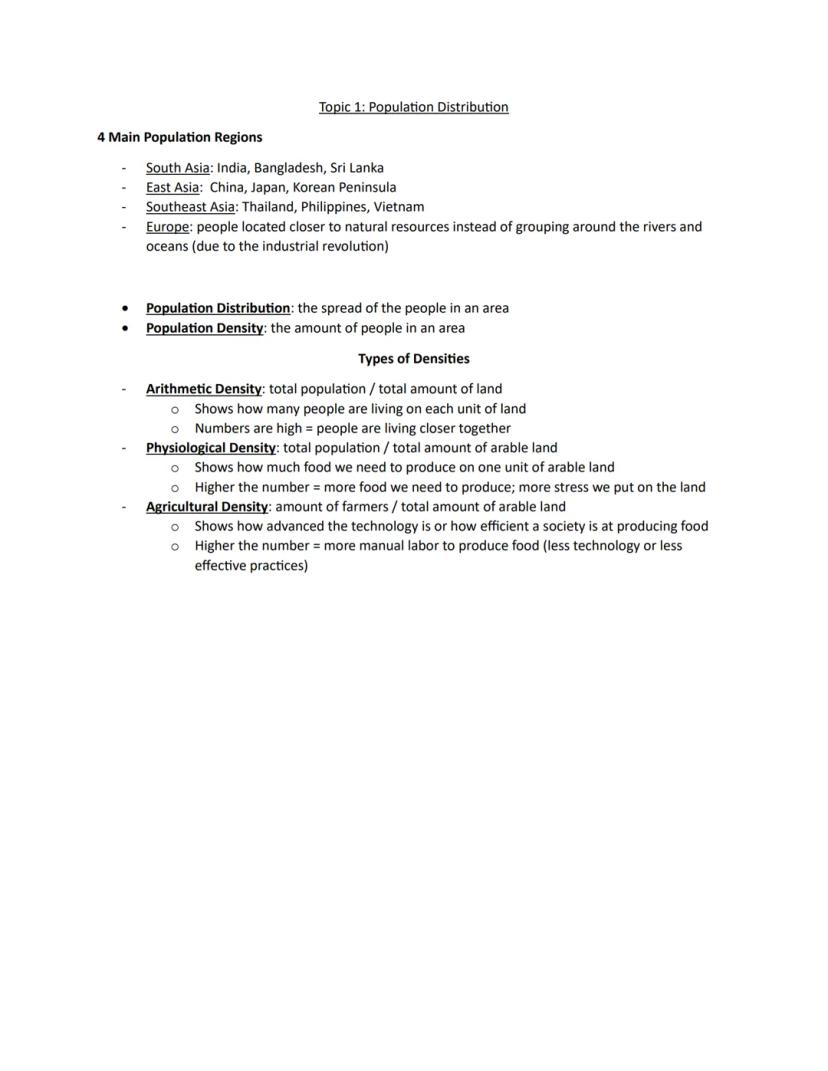
Population Distribution
Ever wonder why people live where they do? Most of the world's population clusters in four main regions: South Asia, East Asia, Southeast Asia, and Europe. While Asian populations traditionally gathered near rivers and oceans, Europeans settled closer to natural resources after the Industrial Revolution.
Two important concepts help us understand how people spread out:
- Population distribution refers to how people are spread across an area
- Population density measures how many people live in an area
There are three ways to measure density:
- Arithmetic density (total population ÷ total land) shows how closely people live together
- Physiological density (total population ÷ arable land) reveals how much pressure there is to produce food
- Agricultural density (farmers ÷ arable land) indicates how advanced farming technology is—higher numbers suggest less technology
💡 Think of physiological density like this: if it's high, each acre of farmland needs to feed more people, creating more stress on the land.
2
of 10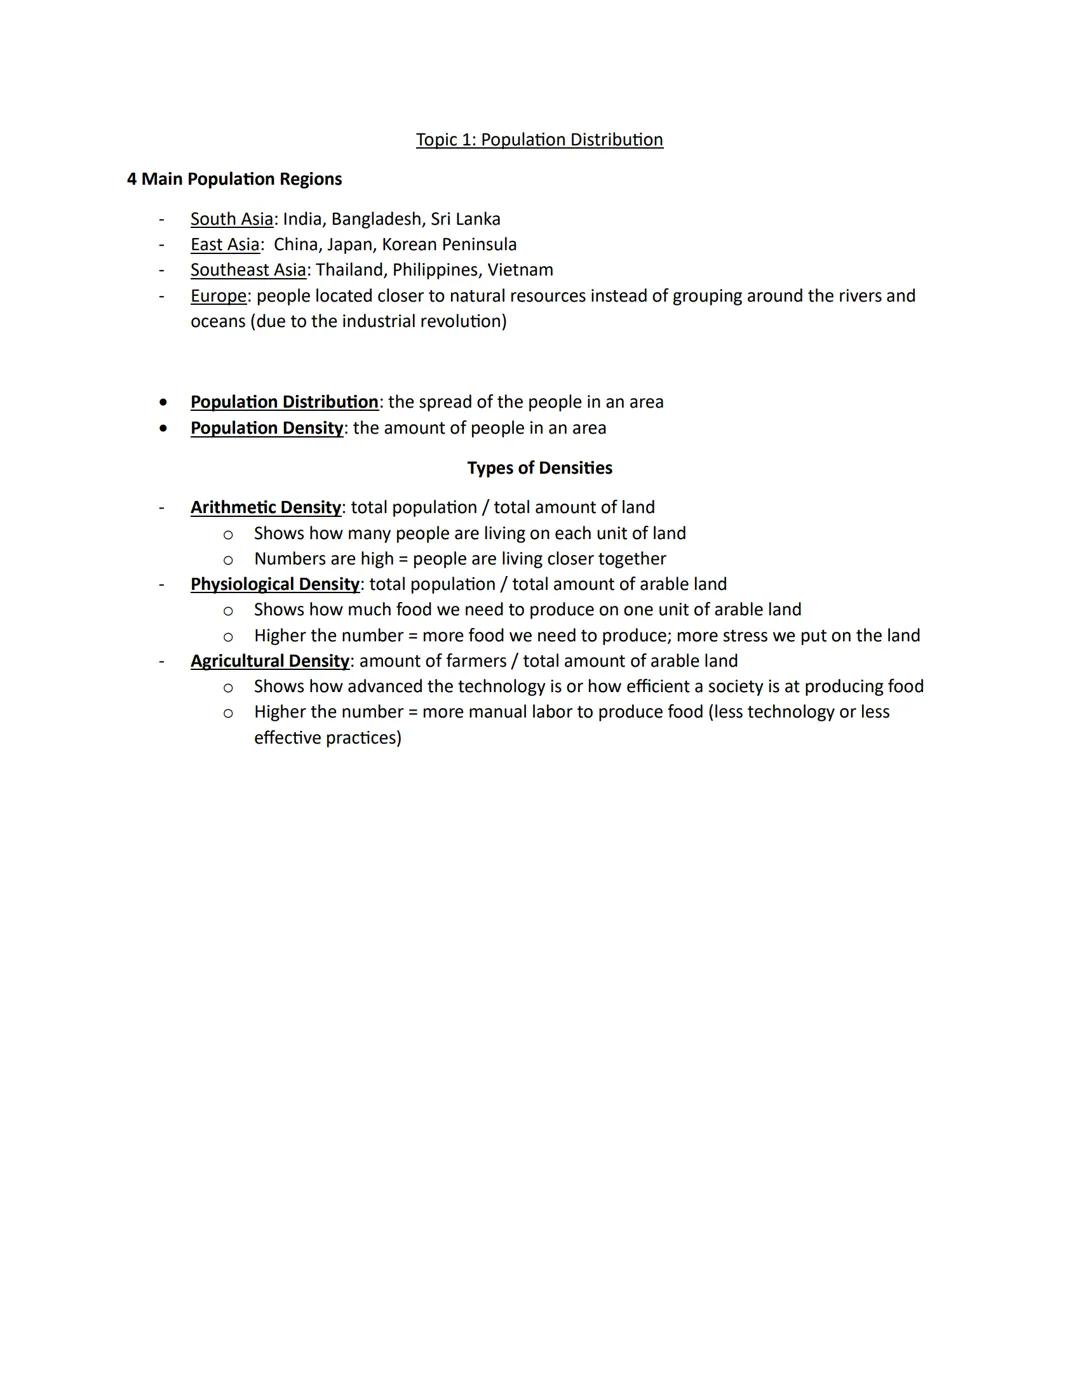
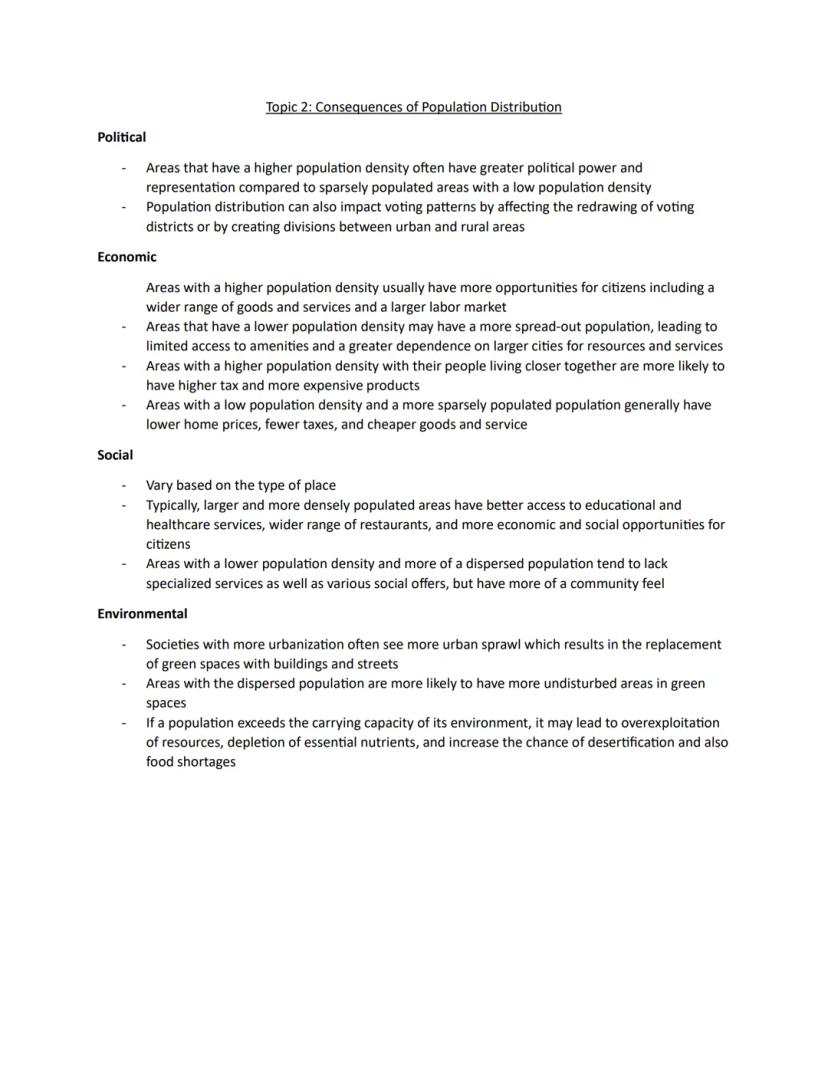
Consequences of Population Distribution
How people spread out affects everything around us! Population distribution creates different impacts across society:
Political impacts are significant. Areas with higher population density often gain greater political power and representation in government. This can create imbalances between urban and rural regions and influence how voting districts are drawn.
Economic consequences vary widely. Densely populated areas typically offer more jobs, goods, and services, but come with higher taxes and more expensive products. In contrast, sparsely populated areas have cheaper housing and lower taxes but fewer economic opportunities.
Social effects depend on location type. Larger, densely populated areas provide better education, healthcare, restaurants, and social opportunities. Areas with lower density may lack specialized services but often have stronger community bonds.
Environmental impacts are unavoidable. Urban areas tend to replace green spaces with buildings and streets (urban sprawl), while areas with dispersed populations maintain more natural spaces. If a population exceeds its environment's carrying capacity, resource depletion and even desertification can occur.
🌍 Next time you visit a different city or rural area, notice how population density affects daily life, from traffic patterns to available services!
3
of 10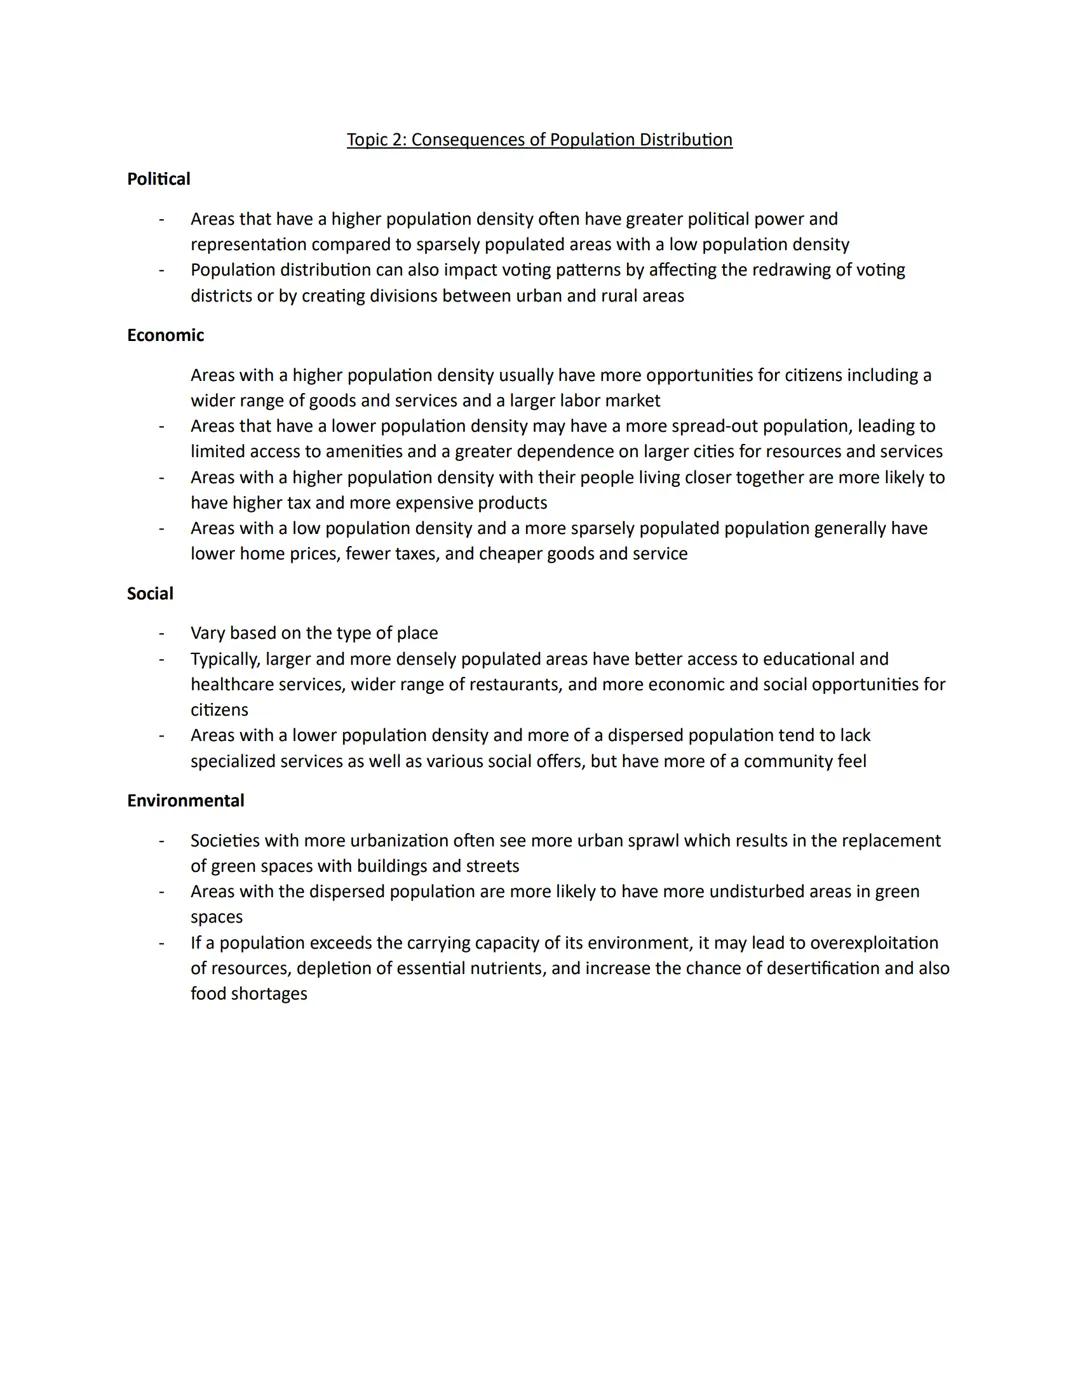
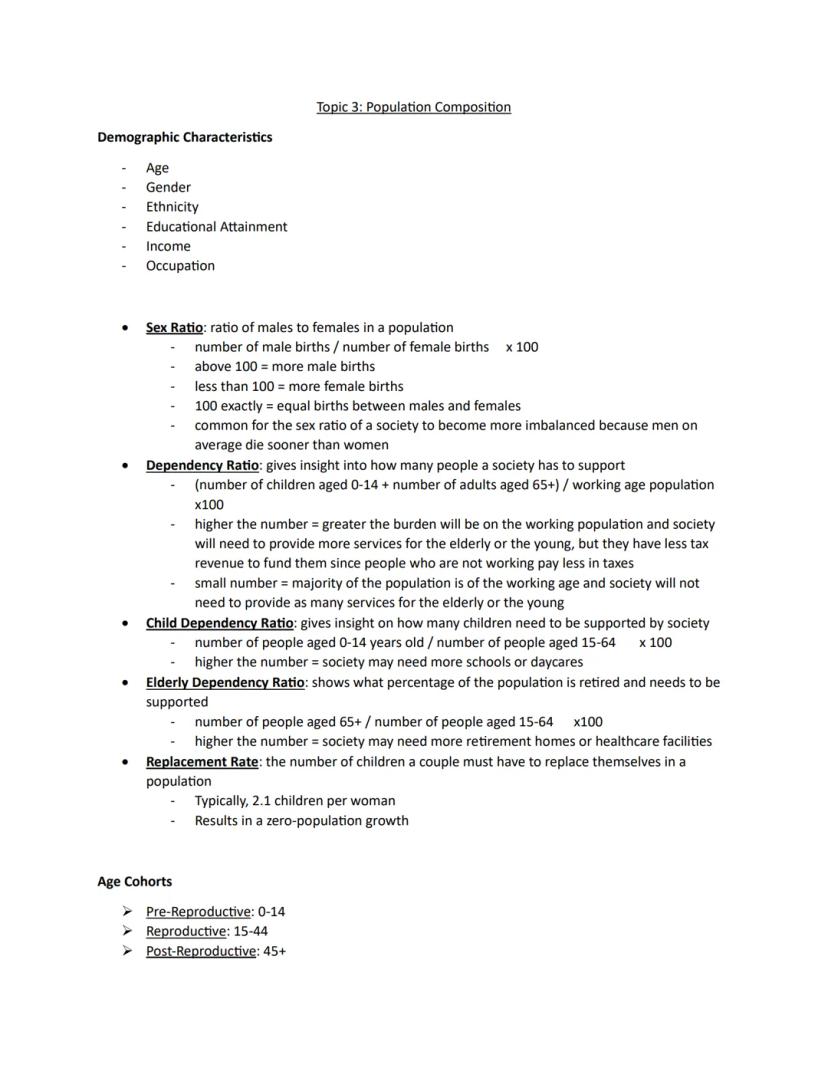
Population Composition
The makeup of a population tells us a lot about a society! Population composition includes demographic characteristics like age, gender, ethnicity, education, income, and occupation.
Several key ratios help us analyze population structure:
- Sex ratio measures males per 100 females in a population
- Dependency ratio shows how many non-working people (young and elderly) society must support compared to working-age people
- Child dependency ratio focuses specifically on children needing support
- Elderly dependency ratio reveals the proportion of retired people requiring support
- Replacement rate is the number of children per couple needed to maintain population (typically 2.1)
Age cohorts divide the population into three key groups:
- Pre-reproductive (0-14 years)
- Reproductive (15-44 years)
- Post-reproductive (45+ years)
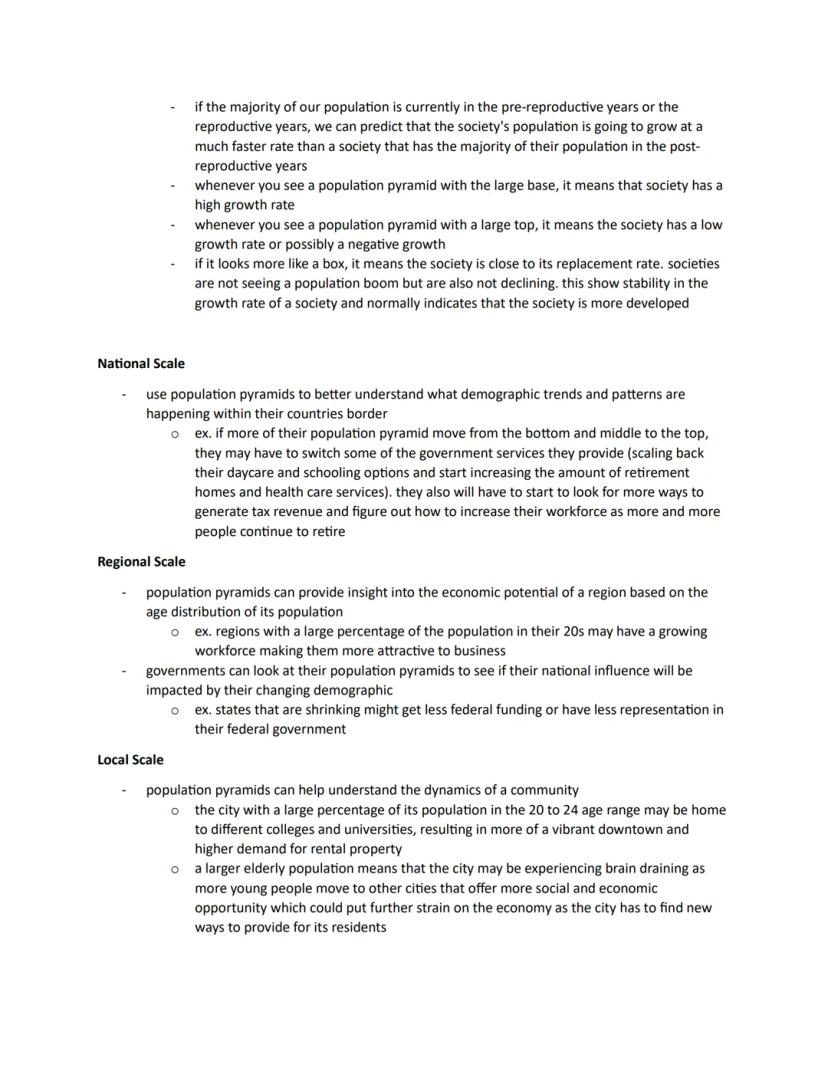
The distribution of people among these groups predicts future population trends. A population with many young people will grow faster than one with mostly older people. Population pyramids visually represent these age distributions—a wide base indicates rapid growth, while a wide top suggests declining population.
📊 Population pyramids are powerful tools! When Japan's pyramid shows more elderly than young people, it signals the need for more healthcare facilities and fewer schools.
4
of 10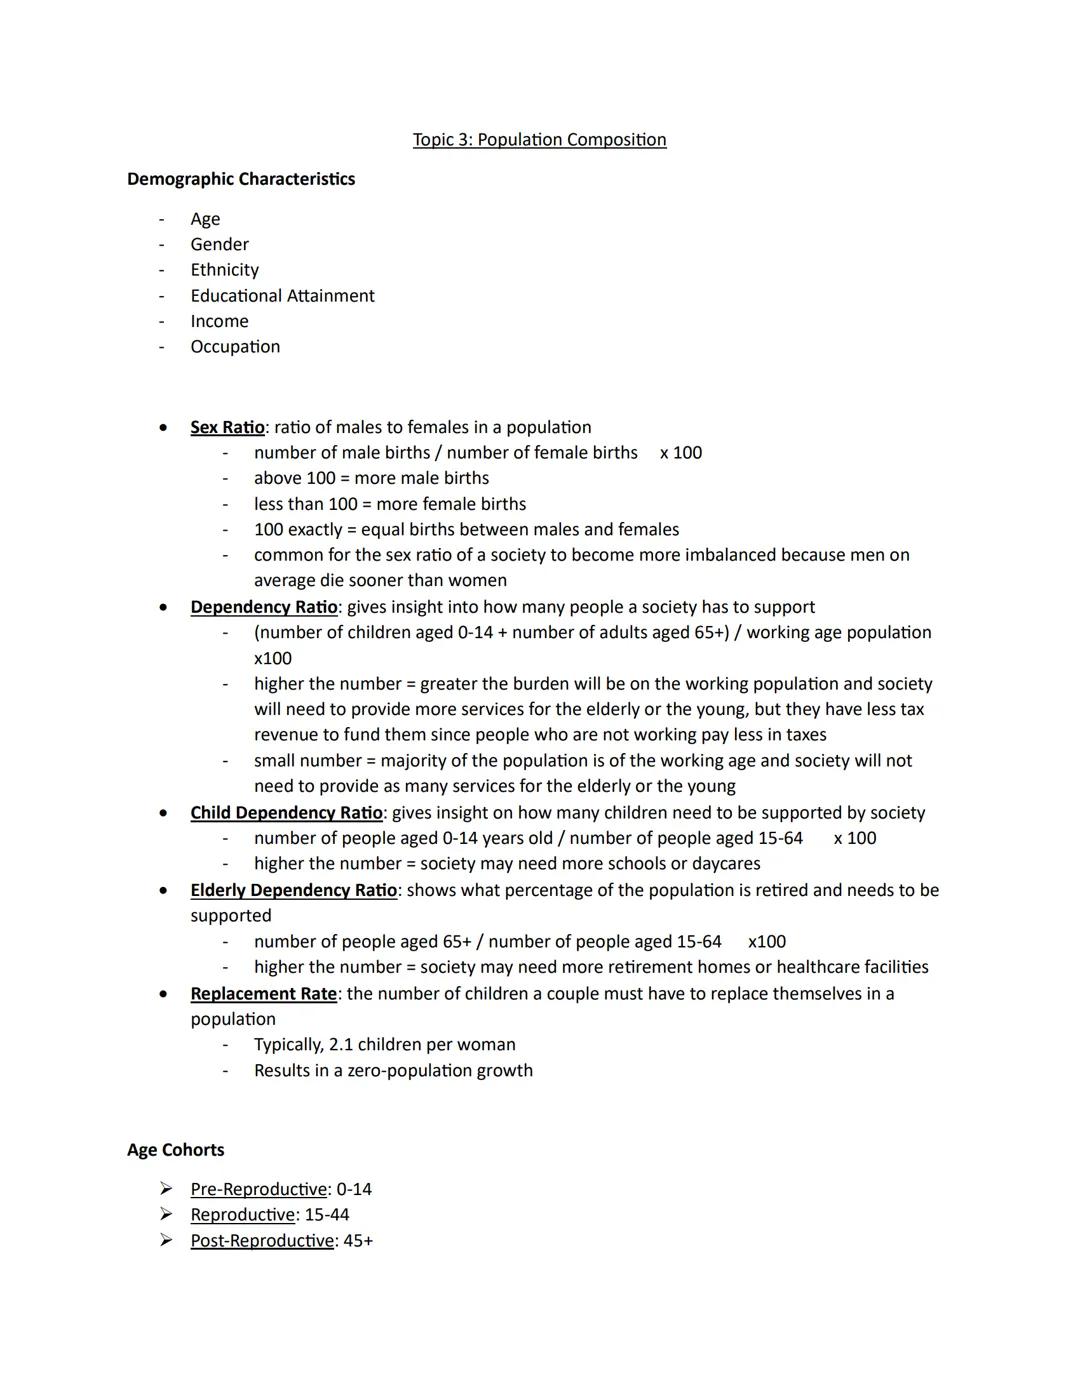
Population Composition Scales
Population data helps us understand trends at different geographic scales!
At the national scale, countries use population pyramids to identify demographic trends and adjust government services. For example, as populations age, countries might reduce school funding while increasing healthcare and retirement services. They also need to find ways to generate tax revenue as more workers retire.
At the regional scale, population pyramids reveal economic potential. Regions with many people in their 20s may attract businesses looking for workers. Governments also use this data to determine how national influence and funding might shift as demographics change.
At the local scale, population pyramids help communities understand their unique character. A city with many 20-24 year-olds might be a college town with vibrant downtown areas and high demand for rentals. A city with mostly elderly residents might be experiencing "brain drain" as younger people leave for better opportunities elsewhere.
Businesses use population data to understand their customer base and potential workforce. City governments use it to plan infrastructure needs like schools, parks, and healthcare facilities.
🏙️ Cities with aging populations face unique challenges. They need to attract younger residents while still caring for their elderly population—all with potentially decreasing tax revenue!
5
of 10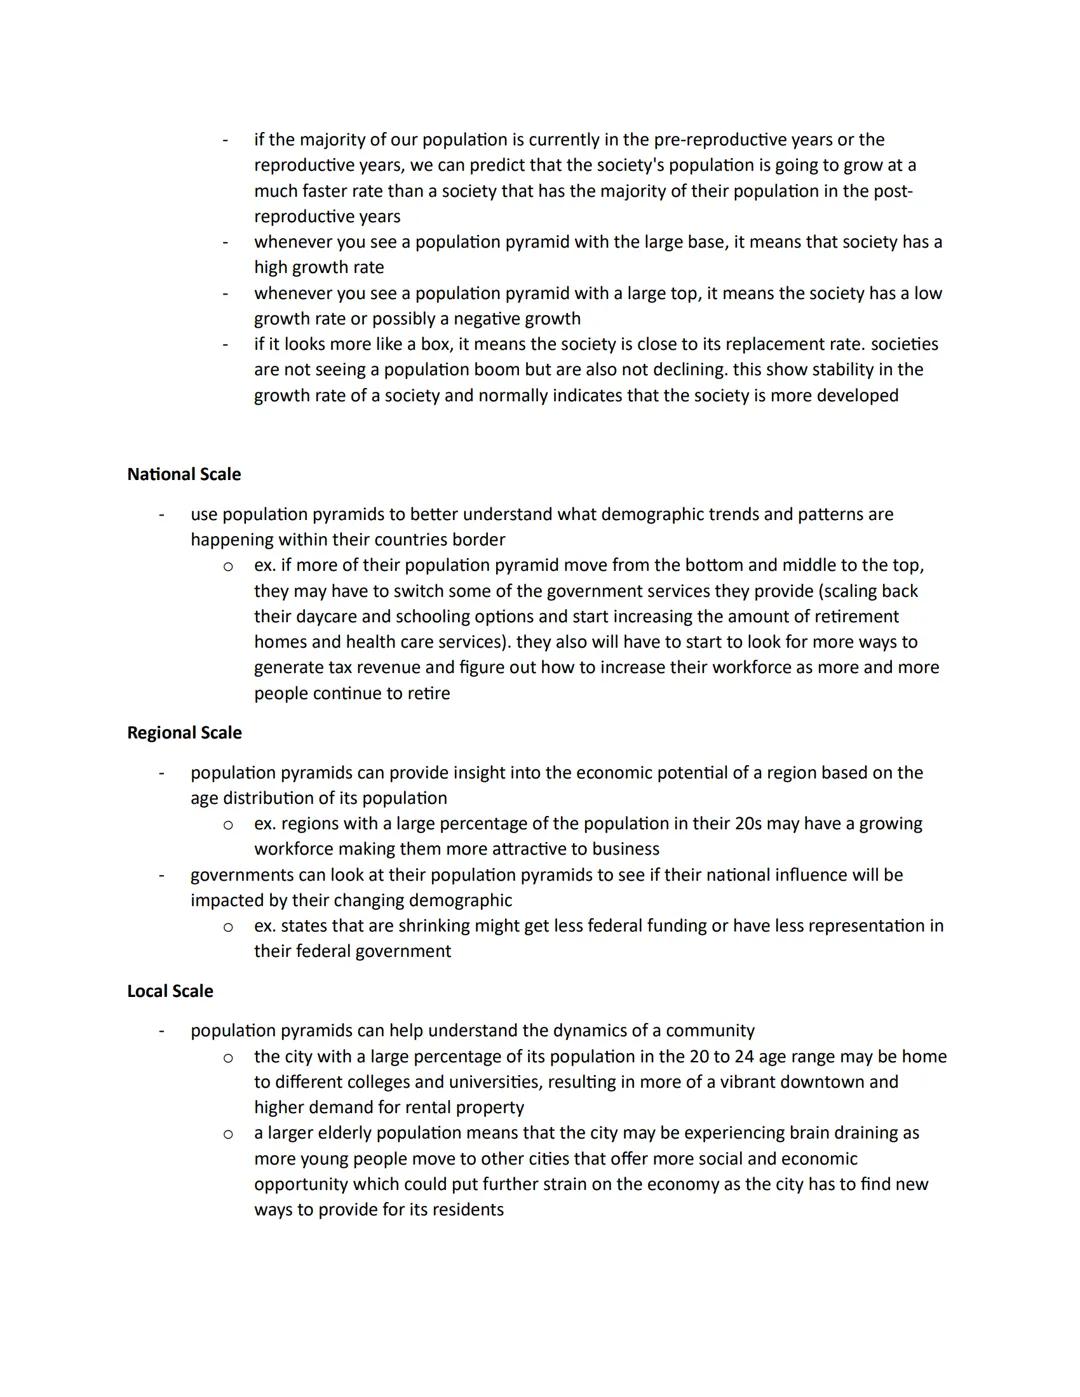
Population Dynamics
How fast is a population growing or shrinking? Population dynamics help us measure and understand population change through several key rates:
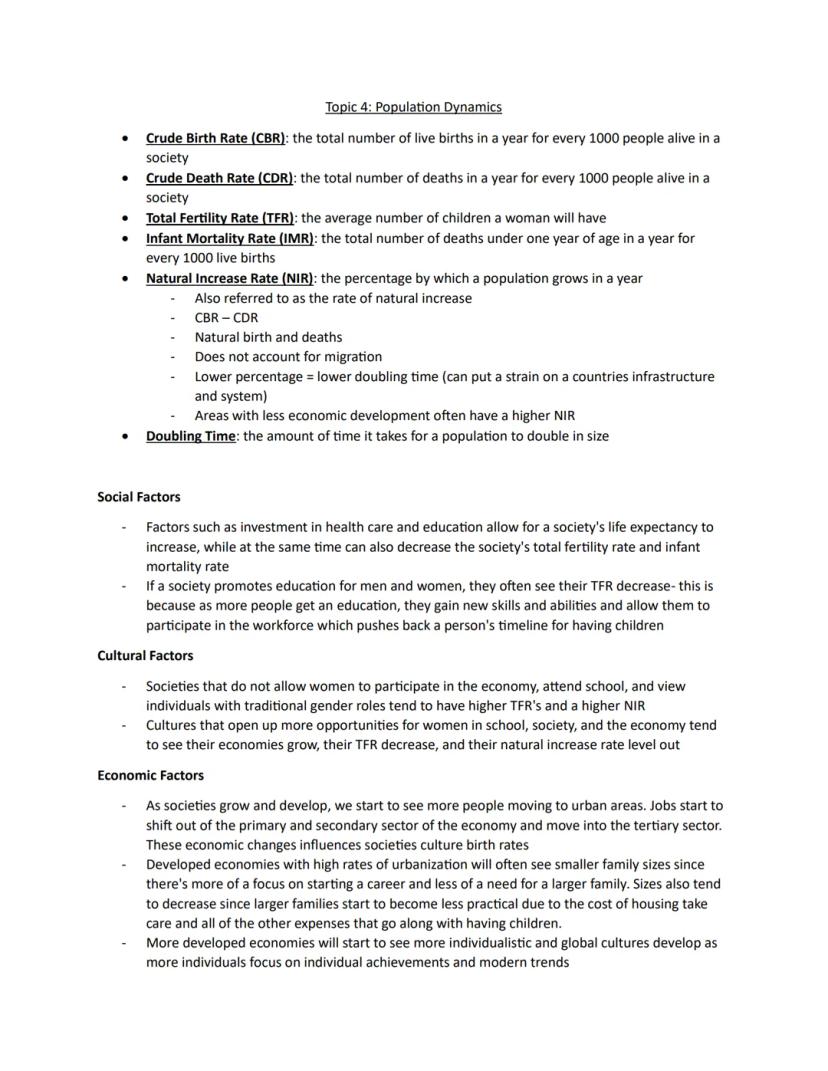
- Crude Birth Rate (CBR): Live births per 1,000 people in a year
- Crude Death Rate (CDR): Deaths per 1,000 people in a year
- Total Fertility Rate (TFR): Average number of children a woman will have
- Infant Mortality Rate (IMR): Deaths of infants under one year per 1,000 live births
- Natural Increase Rate (NIR): Percentage by which a population grows annually (CBR - CDR)
- Doubling Time: Time needed for a population to double in size
Several factors influence these rates:
Social factors like healthcare and education investments can increase life expectancy while decreasing fertility and infant mortality. Education especially tends to reduce birth rates as people develop new skills and delay having children.
Cultural factors play a major role. Societies with traditional gender roles that limit women's opportunities tend to have higher birth rates. Cultures that promote women's education and workforce participation typically see lower birth rates.
Economic factors shape family choices. As societies develop, more people move to urban areas and jobs shift from agriculture to service industries. Developed economies with high urbanization typically have smaller families due to career focus and higher child-raising costs.
🔎 Have you noticed that more developed countries tend to have smaller families? It's not coincidental—economic opportunity, education, and urbanization all contribute to this pattern!
6
of 10
Population Dynamics: Political Factors
Government policies significantly impact population growth! Political decisions can either create opportunities or restrict citizens' rights and choices.
When governments promote family planning, make contraceptives available, and reduce education and childcare costs, they typically decrease population growth. Conversely, when they restrict contraceptives, limit education on family planning, or deny women rights, population growth often increases.
Governments use two main policy approaches:
- Pro-natalist policies aim to increase birth rates
- Anti-natalist policies aim to decrease birth rates
These policies reflect a country's economic needs, cultural values, and demographic challenges. Countries with aging populations might implement pro-natalist policies to ensure enough future workers, while countries struggling with overpopulation might use anti-natalist approaches.
The effectiveness of these policies varies widely based on implementation methods and cultural acceptance. Successful population policies typically work with existing cultural values rather than against them.
💼 Singapore has shifted from anti-natalist policies in the 1960s-70s to pro-natalist policies today as its population ages. Their "Have Three or More" campaign offers tax incentives, housing priority, and other benefits to larger families.
7
of 10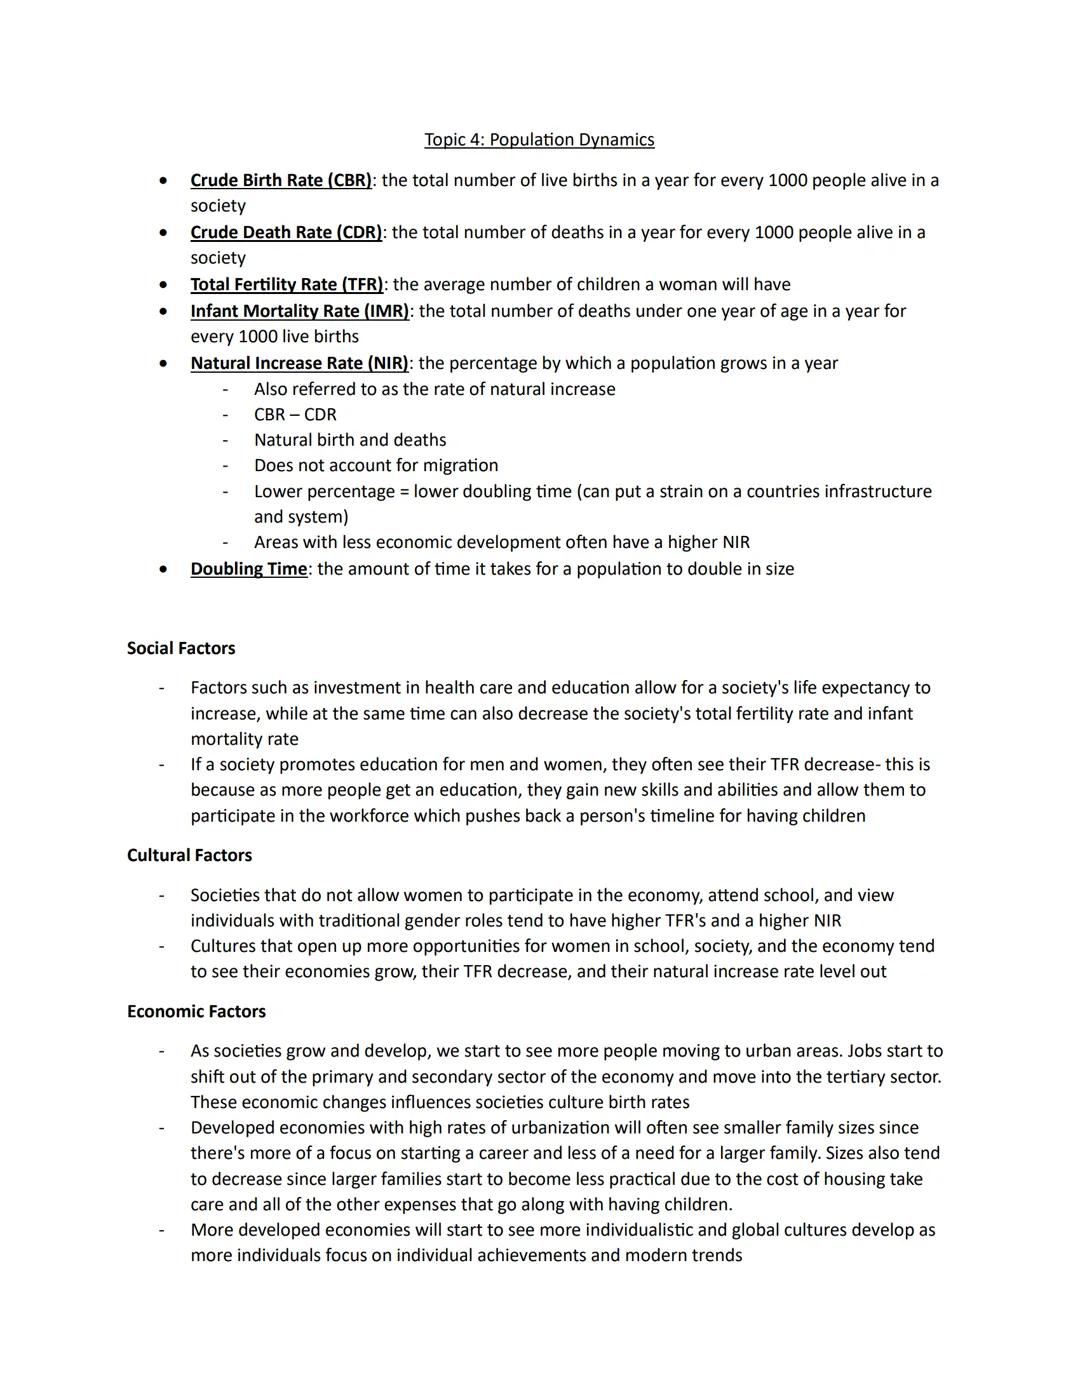
Demographic Transition Model
The Demographic Transition Model (DTM) helps us understand how populations change as societies develop. This five-stage model shows how birth and death rates change over time:
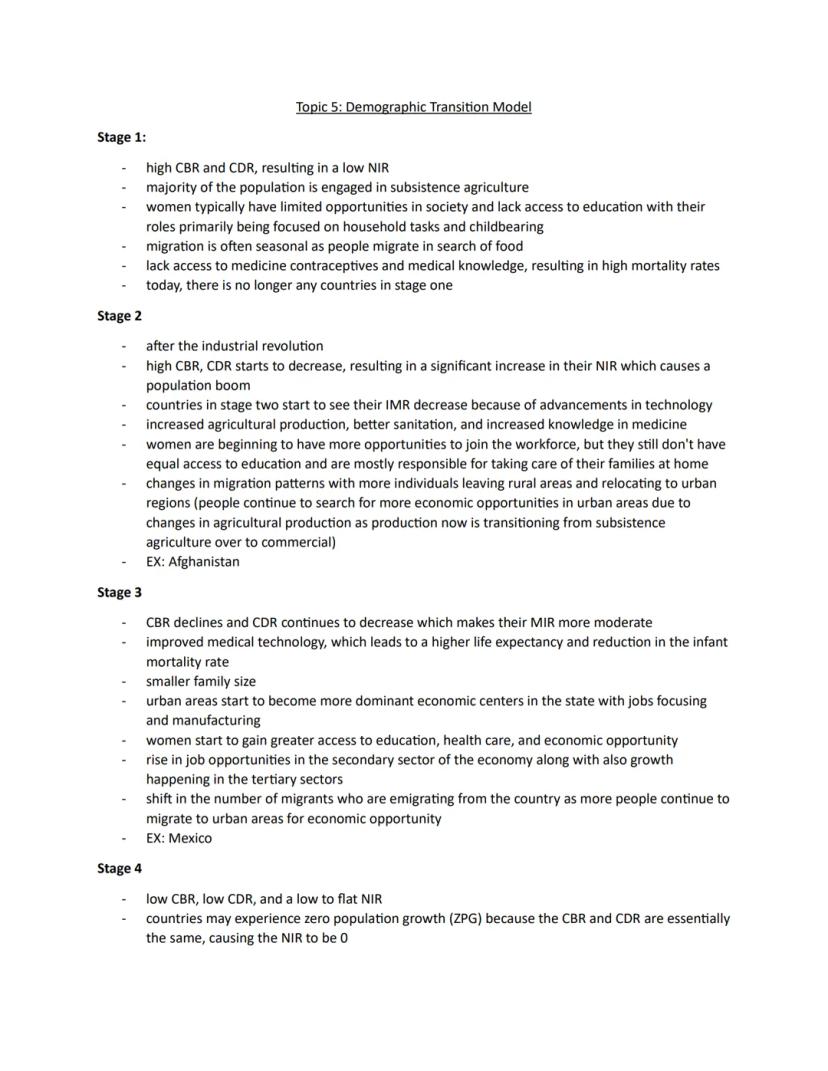
Stage 1: High birth rates and high death rates create slow population growth. People mostly farm for survival, women have limited opportunities, and there's little access to medicine. No countries remain in this stage today.
Stage 2: Birth rates stay high while death rates drop, causing a population boom. Industrial and agricultural advances improve health and reduce infant mortality. Women begin gaining opportunities but still focus primarily on family care. Migration shifts from rural to urban areas. Example: Afghanistan.
Stage 3: Birth rates begin declining while death rates continue decreasing, creating moderate growth. Medical technology improves, family sizes shrink, and urban areas become economic centers. Women gain greater access to education and jobs. Example: Mexico.
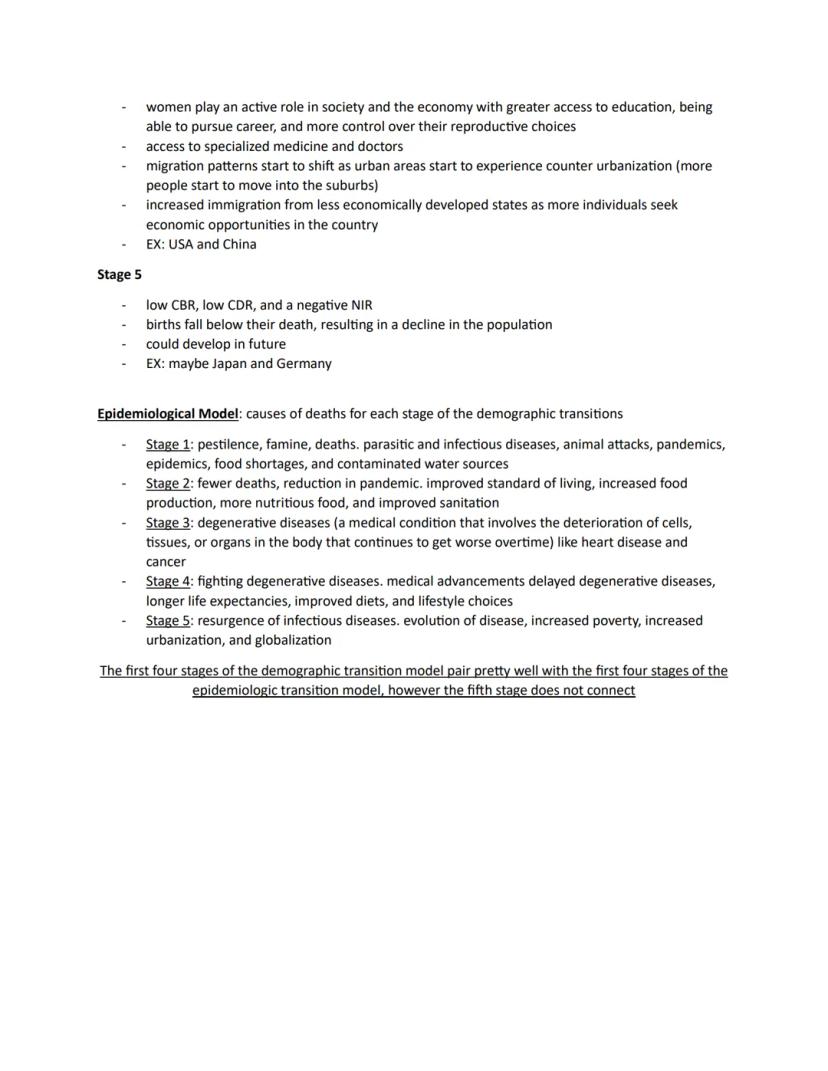
Stage 4: Low birth rates and low death rates create very slow growth or stability (Zero Population Growth). Women actively participate in society and the economy. Urban areas experience "counter-urbanization" as people move to suburbs. Immigration increases from less developed countries. Examples: USA and China.
Stage 5: Birth rates fall below death rates, causing population decline. May be developing in countries like Japan and Germany.
⚕️ The Epidemiological Transition Model complements the DTM by showing how causes of death change—from infectious diseases in early stages to degenerative diseases (like heart disease) in later stages.
8
of 10
Malthusian Theory and Population Policies
Malthusian Theory emerged during the Industrial Revolution when Thomas Malthus observed rapid population growth. He predicted disaster based on a simple idea: population grows exponentially while food production grows arithmetically (linearly). This would eventually cause a "Malthusian Catastrophe" where population exceeds food supply, causing famine, war, and social collapse.
Malthus turned out to be wrong! As societies develop economically, population growth slows, and agricultural technology advances faster than he expected. Still, supporters called Neo-Malthusians continue to worry about population outpacing resources.
Government Population Policies respond to demographic challenges:
Pro-Natalist Policies encourage higher birth rates through:
- Tax incentives for larger families
- Family-friendly workplace policies
- Propaganda promoting family values
- Access to affordable childcare
These are typically implemented in countries with low natural increase rates facing potential population decline.
Anti-Natalist Policies aim to reduce birth rates through:
- Family planning services and education
- Access to contraception
- Incentives for smaller families
- Restrictions on family size (like China's former one-child policy)
These are usually found in countries with high natural increase rates struggling with rapid population growth.
🌐 Immigration policies reflect a country's economic needs, security priorities, and cultural values. Immigration increases economic output, diversity, and innovation while helping offset aging populations in developed countries.
9
of 10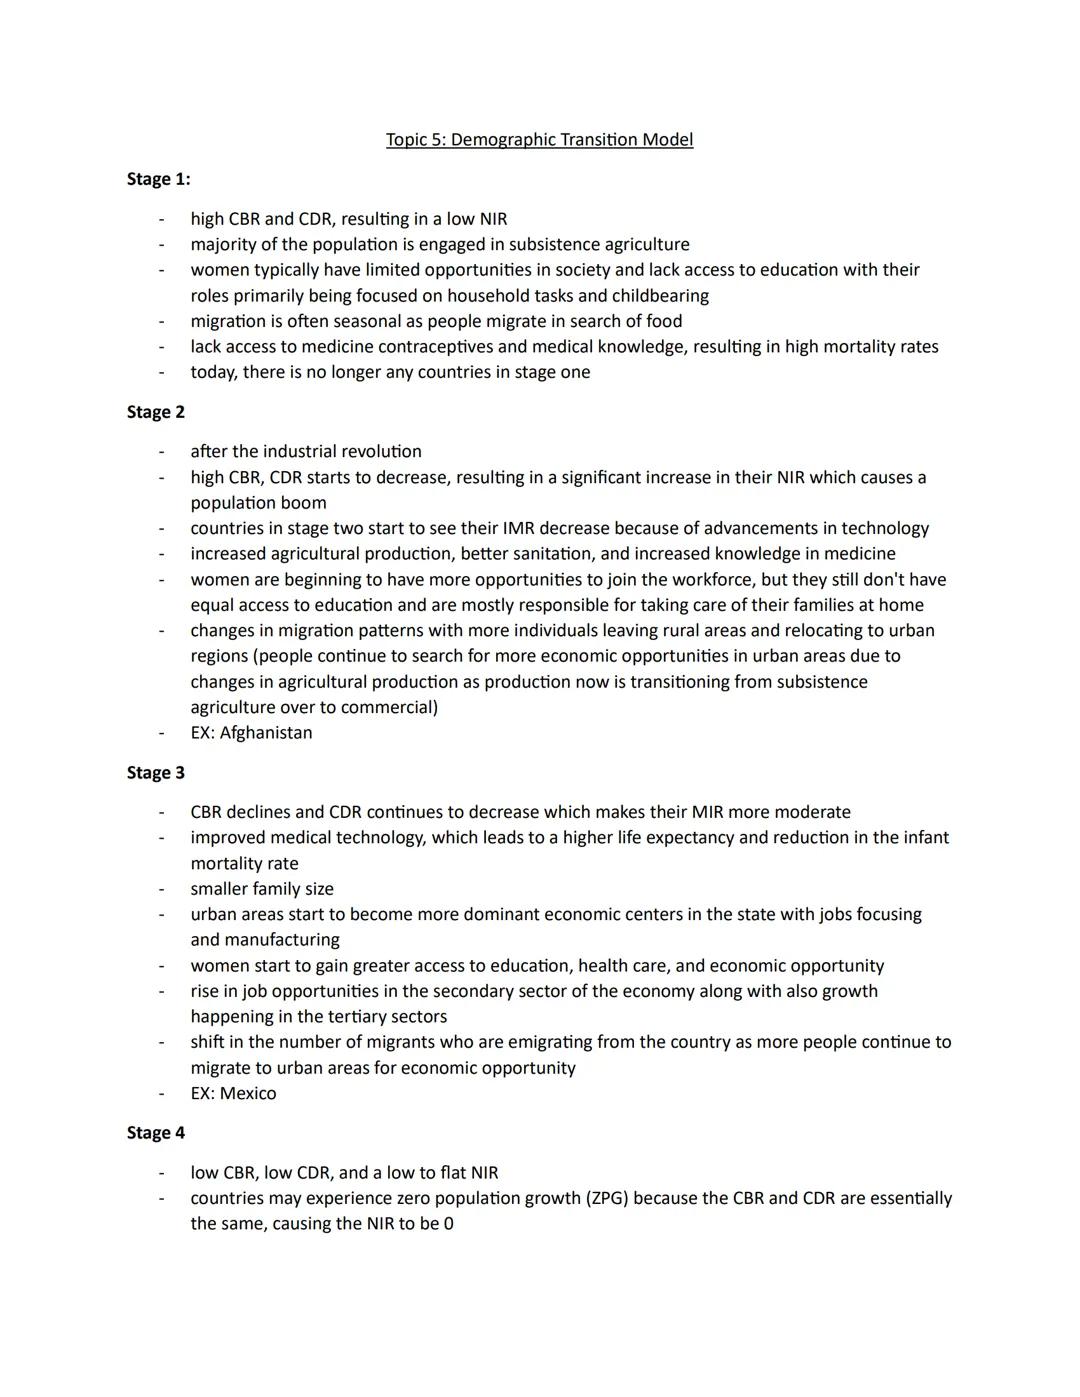
Women and Demographic Changes
The status of women dramatically affects population patterns! In economically developed countries, women typically have:
- Greater access to quality education
- Higher workforce participation
- Better healthcare access
- More control over reproductive choices
These factors lead to lower fertility rates, as educated women often delay having children to pursue education and careers. They also contribute to lower infant and maternal mortality rates.
The maternal mortality rate (deaths per 100,000 live births from pregnancy-related complications) is a key indicator of women's status. It typically decreases as women gain economic opportunities and rights.
Countries with greater gender inequality tend to have higher fertility rates and less economic development. Women in these societies have fewer opportunities, less education, and are often limited to traditional roles as caregivers.
Ravenstein's Laws of Migration connect women's status to migration patterns:
- Most migration happens for economic reasons, especially among young adults
- Migrants often travel short distances through "step migration"
- Migrants typically move from rural to urban areas
- Every migration creates a counter-stream (return migration)
- Females migrate more within countries, while males migrate more internationally
🧠 Women's education is one of the most powerful factors affecting population. For each year of additional schooling, a woman typically has 0.3-0.5 fewer children while earning 10-20% higher wages!
10
of 10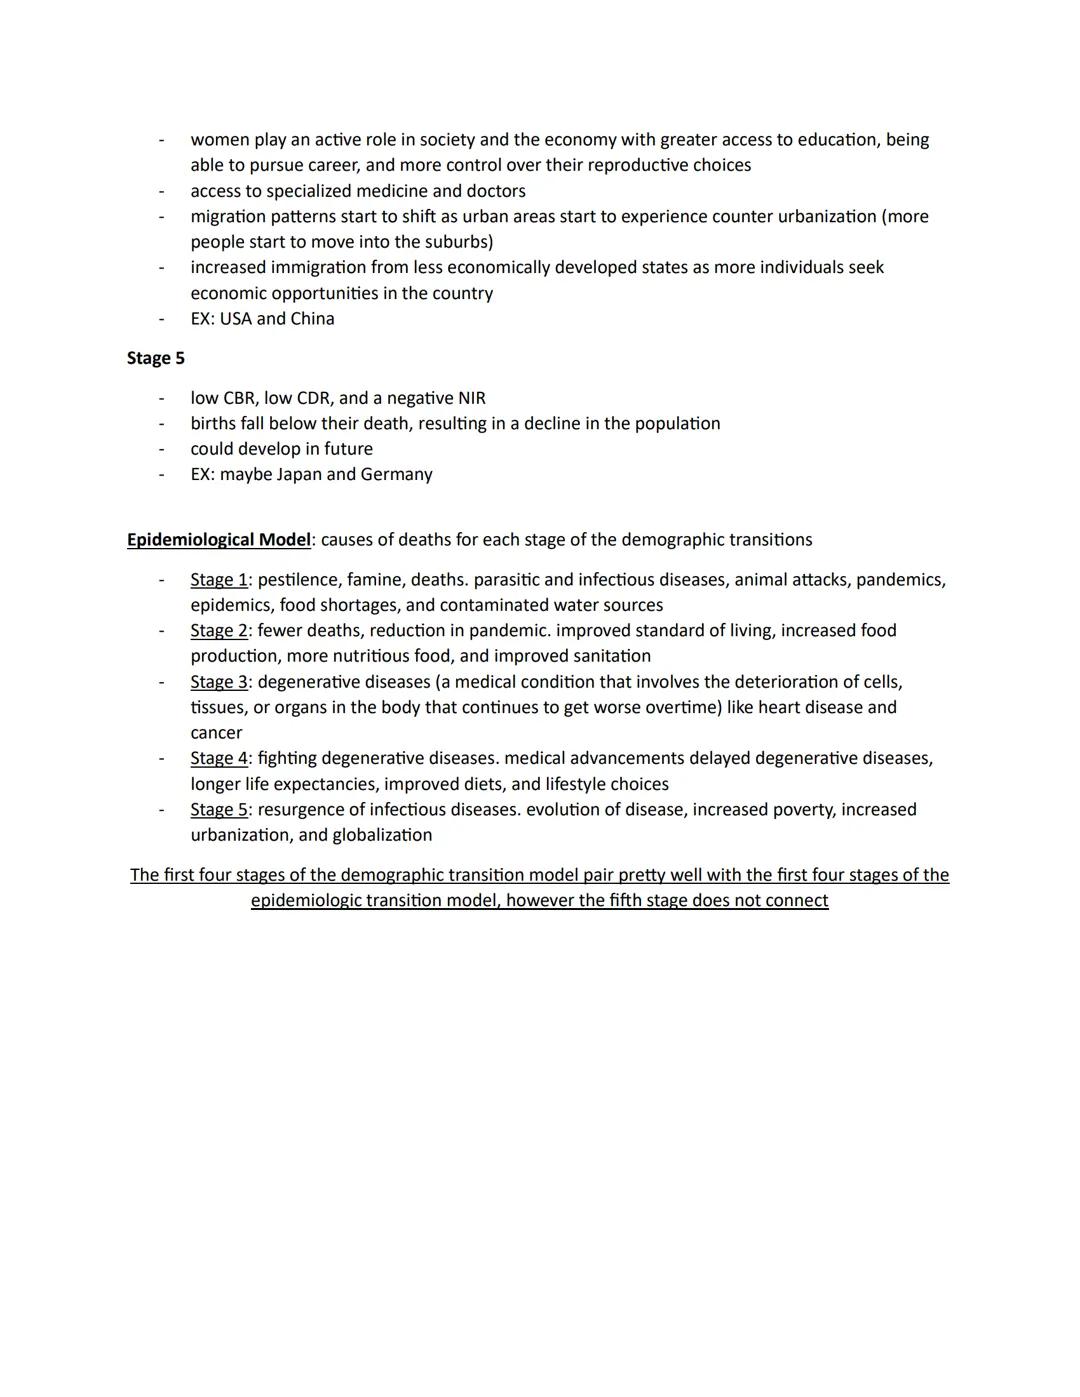
Migration Patterns and Aging Populations
Ravenstein's migration laws continue to explain important patterns:
- Migration flows primarily from agricultural to industrial areas
- Technology and transportation improvements increase migration
- Families are less likely to cross international borders than individuals
Two key concepts help explain migration patterns:
- Step Migration: Movement that happens in stages (village → town → city)
- Gravity Model: Predicts that larger cities attract more migrants, even from farther away, due to more economic, political, and social opportunities
Meanwhile, many developed countries face the challenge of aging populations. As countries develop economically, their populations tend to age, creating several impacts:
- Increasing dependency ratios (more retirees, fewer workers)
- Rising healthcare and retirement costs
- Reduced economic growth as countries raise taxes to support seniors
- Changing family structures as relatives care for elderly family members
- Worker shortages across the economy
Countries typically respond with pro-natalist policies to boost birth rates or pro-immigration policies to attract new workers. Some countries experiment with raising retirement ages or using technology to maintain productivity with fewer workers.
👵 Japan faces one of the world's oldest populations, with 28% of residents over age 65. They're responding with robotics technology to help care for seniors and fill workforce gaps created by their aging society.
We thought you’d never ask...
Our AI companion is specifically built for the needs of students. Based on the millions of content pieces we have on the platform we can provide truly meaningful and relevant answers to students. But its not only about answers, the companion is even more about guiding students through their daily learning challenges, with personalised study plans, quizzes or content pieces in the chat and 100% personalisation based on the students skills and developments.
You can download the app in the Google Play Store and in the Apple App Store.
That's right! Enjoy free access to study content, connect with fellow students, and get instant help – all at your fingertips.
Similar Content
Most popular content in AP Human Geography
9I
Introduction to Geographic Data
Practice identifying types of geographic data, including qualitative and quantitative sources like census data and satellite imagery.
9th5500
I
Introduction to Human-Environmental Interaction
Practice the foundational concepts of environmental determinism and possibilism and their influence on early geographic thought.
9th4520
I
Introduction to Map Properties and Scale
Practice identifying types of map distortion and calculating map scale to understand how physical reality is represented on a flat surface.
9th2860
P
Population: quiz #1!
Master the fundamentals of population with these easy flashcards designed for high school students. Explore key concepts, terms, and examples to ace your exams!
9th1910
U
Unit 2 Measuring Population Density quiz
Measuring Population Density
9th1720
A
AP HUG UNIT 1
This is a little test to help you practice for AP HUG
10th1890
I
Introduction to Geographic Data Scales
Practice identifying and differentiating between local, regional, national, and global scales of analysis using maps and data sets.
9th1810
A
APHUG Unit 1
10 questions just general info you should know if you have listened in your class :D
9th1580
Full Year APHG (Human Geography) Notes
My full Freshman year’s APHG notes compiled on a document.
9th1,920236
Most popular content
9O
Origins and Dynamics of the Columbian Exchange
Analyze the ecological and economic motivations behind the initial transfer of goods, people, and diseases between the Old and New Worlds.
9th3,1280
I
Introduction to Early Cultural Interactions
Analyze the initial social and religious encounters between Europeans, Africans, and Indigenous peoples in the colonial Americas.
9th2,7730
O
Origins of Ancient River Civilizations
Analyze the environmental factors and technological innovations that led to the rise of early states in Mesopotamia, Egypt, and the Indus Valley.
9th3,1870
M
Motivations for European Exploration
Analyze the economic, religious, and political factors that drove European powers to the Americas during the 15th and 16th centuries.
9th1,7780
F
Foundations of Ethical Guidelines in Research
Practice the core principles of the APA ethical code including informed consent, debriefing, and the role of Institutional Review Boards.
9th1,3360
I
Introduction to Native American Societies
Examine the diverse social, political, and economic structures of North American indigenous groups prior to European contact.
9th1,1100
I
Introduction to the Spanish Encomienda System
Explore the fundamental economic and social structures of the Spanish colonial system, focusing on the encomienda and the casta social hierarchy.
9th8890
I
Introduction to Biological Elements of Life
Practice identifying the essential elements including carbon, nitrogen, phosphorus, and sulfur that compose biological macromolecules.
9th1,7410
O
Origins of the Articles of Confederation
Practice identifying the motivations for a weak central government and the specific powers granted to the states under the first U.S. constitution.
9th9370
Students love us — and so will you.
4.6/5App Store
4.7/5Google Play
The app is very easy to use and well designed. I have found everything I was looking for so far and have been able to learn a lot from the presentations! I will definitely use the app for a class assignment! And of course it also helps a lot as an inspiration.
Stefan SiOS user
This app is really great. There are so many study notes and help [...]. My problem subject is French, for example, and the app has so many options for help. Thanks to this app, I have improved my French. I would recommend it to anyone.
Samantha KlichAndroid user
Wow, I am really amazed. I just tried the app because I've seen it advertised many times and was absolutely stunned. This app is THE HELP you want for school and above all, it offers so many things, such as workouts and fact sheets, which have been VERY helpful to me personally.
AnnaiOS user
APHG Unit 2 Study Notes
H
Harkiran@xoxo.harkiran
Welcome to Unit 2 of your AP Human Geography course! This unit explores how humans spread across the globe, what factors influence population growth, and how migration shapes our world. Understanding population patterns helps explain why some areas are crowded...
1
of 10
Sign up to see the content. It's free!
- Access to all documents
- Improve your grades
- Join milions of students
Population Distribution
Ever wonder why people live where they do? Most of the world's population clusters in four main regions: South Asia, East Asia, Southeast Asia, and Europe. While Asian populations traditionally gathered near rivers and oceans, Europeans settled closer to natural resources after the Industrial Revolution.
Two important concepts help us understand how people spread out:
- Population distribution refers to how people are spread across an area
- Population density measures how many people live in an area
There are three ways to measure density:
- Arithmetic density (total population ÷ total land) shows how closely people live together
- Physiological density (total population ÷ arable land) reveals how much pressure there is to produce food
- Agricultural density (farmers ÷ arable land) indicates how advanced farming technology is—higher numbers suggest less technology
💡 Think of physiological density like this: if it's high, each acre of farmland needs to feed more people, creating more stress on the land.
2
of 10Sign up to see the content. It's free!
- Access to all documents
- Improve your grades
- Join milions of students
Consequences of Population Distribution
How people spread out affects everything around us! Population distribution creates different impacts across society:
Political impacts are significant. Areas with higher population density often gain greater political power and representation in government. This can create imbalances between urban and rural regions and influence how voting districts are drawn.
Economic consequences vary widely. Densely populated areas typically offer more jobs, goods, and services, but come with higher taxes and more expensive products. In contrast, sparsely populated areas have cheaper housing and lower taxes but fewer economic opportunities.
Social effects depend on location type. Larger, densely populated areas provide better education, healthcare, restaurants, and social opportunities. Areas with lower density may lack specialized services but often have stronger community bonds.
Environmental impacts are unavoidable. Urban areas tend to replace green spaces with buildings and streets (urban sprawl), while areas with dispersed populations maintain more natural spaces. If a population exceeds its environment's carrying capacity, resource depletion and even desertification can occur.
🌍 Next time you visit a different city or rural area, notice how population density affects daily life, from traffic patterns to available services!
3
of 10Sign up to see the content. It's free!
- Access to all documents
- Improve your grades
- Join milions of students
Population Composition
The makeup of a population tells us a lot about a society! Population composition includes demographic characteristics like age, gender, ethnicity, education, income, and occupation.
Several key ratios help us analyze population structure:
- Sex ratio measures males per 100 females in a population
- Dependency ratio shows how many non-working people (young and elderly) society must support compared to working-age people
- Child dependency ratio focuses specifically on children needing support
- Elderly dependency ratio reveals the proportion of retired people requiring support
- Replacement rate is the number of children per couple needed to maintain population (typically 2.1)
Age cohorts divide the population into three key groups:
- Pre-reproductive (0-14 years)
- Reproductive (15-44 years)
- Post-reproductive (45+ years)
The distribution of people among these groups predicts future population trends. A population with many young people will grow faster than one with mostly older people. Population pyramids visually represent these age distributions—a wide base indicates rapid growth, while a wide top suggests declining population.
📊 Population pyramids are powerful tools! When Japan's pyramid shows more elderly than young people, it signals the need for more healthcare facilities and fewer schools.
4
of 10Sign up to see the content. It's free!
- Access to all documents
- Improve your grades
- Join milions of students
Population Composition Scales
Population data helps us understand trends at different geographic scales!
At the national scale, countries use population pyramids to identify demographic trends and adjust government services. For example, as populations age, countries might reduce school funding while increasing healthcare and retirement services. They also need to find ways to generate tax revenue as more workers retire.
At the regional scale, population pyramids reveal economic potential. Regions with many people in their 20s may attract businesses looking for workers. Governments also use this data to determine how national influence and funding might shift as demographics change.
At the local scale, population pyramids help communities understand their unique character. A city with many 20-24 year-olds might be a college town with vibrant downtown areas and high demand for rentals. A city with mostly elderly residents might be experiencing "brain drain" as younger people leave for better opportunities elsewhere.
Businesses use population data to understand their customer base and potential workforce. City governments use it to plan infrastructure needs like schools, parks, and healthcare facilities.
🏙️ Cities with aging populations face unique challenges. They need to attract younger residents while still caring for their elderly population—all with potentially decreasing tax revenue!
5
of 10Sign up to see the content. It's free!
- Access to all documents
- Improve your grades
- Join milions of students
Population Dynamics
How fast is a population growing or shrinking? Population dynamics help us measure and understand population change through several key rates:
- Crude Birth Rate (CBR): Live births per 1,000 people in a year
- Crude Death Rate (CDR): Deaths per 1,000 people in a year
- Total Fertility Rate (TFR): Average number of children a woman will have
- Infant Mortality Rate (IMR): Deaths of infants under one year per 1,000 live births
- Natural Increase Rate (NIR): Percentage by which a population grows annually (CBR - CDR)
- Doubling Time: Time needed for a population to double in size
Several factors influence these rates:
Social factors like healthcare and education investments can increase life expectancy while decreasing fertility and infant mortality. Education especially tends to reduce birth rates as people develop new skills and delay having children.
Cultural factors play a major role. Societies with traditional gender roles that limit women's opportunities tend to have higher birth rates. Cultures that promote women's education and workforce participation typically see lower birth rates.
Economic factors shape family choices. As societies develop, more people move to urban areas and jobs shift from agriculture to service industries. Developed economies with high urbanization typically have smaller families due to career focus and higher child-raising costs.
🔎 Have you noticed that more developed countries tend to have smaller families? It's not coincidental—economic opportunity, education, and urbanization all contribute to this pattern!
6
of 10Sign up to see the content. It's free!
- Access to all documents
- Improve your grades
- Join milions of students
Population Dynamics: Political Factors
Government policies significantly impact population growth! Political decisions can either create opportunities or restrict citizens' rights and choices.
When governments promote family planning, make contraceptives available, and reduce education and childcare costs, they typically decrease population growth. Conversely, when they restrict contraceptives, limit education on family planning, or deny women rights, population growth often increases.
Governments use two main policy approaches:
- Pro-natalist policies aim to increase birth rates
- Anti-natalist policies aim to decrease birth rates
These policies reflect a country's economic needs, cultural values, and demographic challenges. Countries with aging populations might implement pro-natalist policies to ensure enough future workers, while countries struggling with overpopulation might use anti-natalist approaches.
The effectiveness of these policies varies widely based on implementation methods and cultural acceptance. Successful population policies typically work with existing cultural values rather than against them.
💼 Singapore has shifted from anti-natalist policies in the 1960s-70s to pro-natalist policies today as its population ages. Their "Have Three or More" campaign offers tax incentives, housing priority, and other benefits to larger families.
7
of 10Sign up to see the content. It's free!
- Access to all documents
- Improve your grades
- Join milions of students
Demographic Transition Model
The Demographic Transition Model (DTM) helps us understand how populations change as societies develop. This five-stage model shows how birth and death rates change over time:
Stage 1: High birth rates and high death rates create slow population growth. People mostly farm for survival, women have limited opportunities, and there's little access to medicine. No countries remain in this stage today.
Stage 2: Birth rates stay high while death rates drop, causing a population boom. Industrial and agricultural advances improve health and reduce infant mortality. Women begin gaining opportunities but still focus primarily on family care. Migration shifts from rural to urban areas. Example: Afghanistan.
Stage 3: Birth rates begin declining while death rates continue decreasing, creating moderate growth. Medical technology improves, family sizes shrink, and urban areas become economic centers. Women gain greater access to education and jobs. Example: Mexico.
Stage 4: Low birth rates and low death rates create very slow growth or stability (Zero Population Growth). Women actively participate in society and the economy. Urban areas experience "counter-urbanization" as people move to suburbs. Immigration increases from less developed countries. Examples: USA and China.
Stage 5: Birth rates fall below death rates, causing population decline. May be developing in countries like Japan and Germany.
⚕️ The Epidemiological Transition Model complements the DTM by showing how causes of death change—from infectious diseases in early stages to degenerative diseases (like heart disease) in later stages.
8
of 10Sign up to see the content. It's free!
- Access to all documents
- Improve your grades
- Join milions of students
Malthusian Theory and Population Policies
Malthusian Theory emerged during the Industrial Revolution when Thomas Malthus observed rapid population growth. He predicted disaster based on a simple idea: population grows exponentially while food production grows arithmetically (linearly). This would eventually cause a "Malthusian Catastrophe" where population exceeds food supply, causing famine, war, and social collapse.
Malthus turned out to be wrong! As societies develop economically, population growth slows, and agricultural technology advances faster than he expected. Still, supporters called Neo-Malthusians continue to worry about population outpacing resources.
Government Population Policies respond to demographic challenges:
Pro-Natalist Policies encourage higher birth rates through:
- Tax incentives for larger families
- Family-friendly workplace policies
- Propaganda promoting family values
- Access to affordable childcare
These are typically implemented in countries with low natural increase rates facing potential population decline.
Anti-Natalist Policies aim to reduce birth rates through:
- Family planning services and education
- Access to contraception
- Incentives for smaller families
- Restrictions on family size (like China's former one-child policy)
These are usually found in countries with high natural increase rates struggling with rapid population growth.
🌐 Immigration policies reflect a country's economic needs, security priorities, and cultural values. Immigration increases economic output, diversity, and innovation while helping offset aging populations in developed countries.
9
of 10Sign up to see the content. It's free!
- Access to all documents
- Improve your grades
- Join milions of students
Women and Demographic Changes
The status of women dramatically affects population patterns! In economically developed countries, women typically have:
- Greater access to quality education
- Higher workforce participation
- Better healthcare access
- More control over reproductive choices
These factors lead to lower fertility rates, as educated women often delay having children to pursue education and careers. They also contribute to lower infant and maternal mortality rates.
The maternal mortality rate (deaths per 100,000 live births from pregnancy-related complications) is a key indicator of women's status. It typically decreases as women gain economic opportunities and rights.
Countries with greater gender inequality tend to have higher fertility rates and less economic development. Women in these societies have fewer opportunities, less education, and are often limited to traditional roles as caregivers.
Ravenstein's Laws of Migration connect women's status to migration patterns:
- Most migration happens for economic reasons, especially among young adults
- Migrants often travel short distances through "step migration"
- Migrants typically move from rural to urban areas
- Every migration creates a counter-stream (return migration)
- Females migrate more within countries, while males migrate more internationally
🧠 Women's education is one of the most powerful factors affecting population. For each year of additional schooling, a woman typically has 0.3-0.5 fewer children while earning 10-20% higher wages!
10
of 10Sign up to see the content. It's free!
- Access to all documents
- Improve your grades
- Join milions of students
Migration Patterns and Aging Populations
Ravenstein's migration laws continue to explain important patterns:
- Migration flows primarily from agricultural to industrial areas
- Technology and transportation improvements increase migration
- Families are less likely to cross international borders than individuals
Two key concepts help explain migration patterns:
- Step Migration: Movement that happens in stages (village → town → city)
- Gravity Model: Predicts that larger cities attract more migrants, even from farther away, due to more economic, political, and social opportunities
Meanwhile, many developed countries face the challenge of aging populations. As countries develop economically, their populations tend to age, creating several impacts:
- Increasing dependency ratios (more retirees, fewer workers)
- Rising healthcare and retirement costs
- Reduced economic growth as countries raise taxes to support seniors
- Changing family structures as relatives care for elderly family members
- Worker shortages across the economy
Countries typically respond with pro-natalist policies to boost birth rates or pro-immigration policies to attract new workers. Some countries experiment with raising retirement ages or using technology to maintain productivity with fewer workers.
👵 Japan faces one of the world's oldest populations, with 28% of residents over age 65. They're responding with robotics technology to help care for seniors and fill workforce gaps created by their aging society.
We thought you’d never ask...
Our AI companion is specifically built for the needs of students. Based on the millions of content pieces we have on the platform we can provide truly meaningful and relevant answers to students. But its not only about answers, the companion is even more about guiding students through their daily learning challenges, with personalised study plans, quizzes or content pieces in the chat and 100% personalisation based on the students skills and developments.
You can download the app in the Google Play Store and in the Apple App Store.
That's right! Enjoy free access to study content, connect with fellow students, and get instant help – all at your fingertips.
Similar Content
Most popular content in AP Human Geography
9I
Introduction to Geographic Data
Practice identifying types of geographic data, including qualitative and quantitative sources like census data and satellite imagery.
9th5500
I
Introduction to Human-Environmental Interaction
Practice the foundational concepts of environmental determinism and possibilism and their influence on early geographic thought.
9th4520
I
Introduction to Map Properties and Scale
Practice identifying types of map distortion and calculating map scale to understand how physical reality is represented on a flat surface.
9th2860
P
Population: quiz #1!
Master the fundamentals of population with these easy flashcards designed for high school students. Explore key concepts, terms, and examples to ace your exams!
9th1910
U
Unit 2 Measuring Population Density quiz
Measuring Population Density
9th1720
A
AP HUG UNIT 1
This is a little test to help you practice for AP HUG
10th1890
I
Introduction to Geographic Data Scales
Practice identifying and differentiating between local, regional, national, and global scales of analysis using maps and data sets.
9th1810
A
APHUG Unit 1
10 questions just general info you should know if you have listened in your class :D
9th1580
Full Year APHG (Human Geography) Notes
My full Freshman year’s APHG notes compiled on a document.
9th1,920236
Most popular content
9O
Origins and Dynamics of the Columbian Exchange
Analyze the ecological and economic motivations behind the initial transfer of goods, people, and diseases between the Old and New Worlds.
9th3,1280
I
Introduction to Early Cultural Interactions
Analyze the initial social and religious encounters between Europeans, Africans, and Indigenous peoples in the colonial Americas.
9th2,7730
O
Origins of Ancient River Civilizations
Analyze the environmental factors and technological innovations that led to the rise of early states in Mesopotamia, Egypt, and the Indus Valley.
9th3,1870
M
Motivations for European Exploration
Analyze the economic, religious, and political factors that drove European powers to the Americas during the 15th and 16th centuries.
9th1,7780
F
Foundations of Ethical Guidelines in Research
Practice the core principles of the APA ethical code including informed consent, debriefing, and the role of Institutional Review Boards.
9th1,3360
I
Introduction to Native American Societies
Examine the diverse social, political, and economic structures of North American indigenous groups prior to European contact.
9th1,1100
I
Introduction to the Spanish Encomienda System
Explore the fundamental economic and social structures of the Spanish colonial system, focusing on the encomienda and the casta social hierarchy.
9th8890
I
Introduction to Biological Elements of Life
Practice identifying the essential elements including carbon, nitrogen, phosphorus, and sulfur that compose biological macromolecules.
9th1,7410
O
Origins of the Articles of Confederation
Practice identifying the motivations for a weak central government and the specific powers granted to the states under the first U.S. constitution.
9th9370
Students love us — and so will you.
4.6/5App Store
4.7/5Google Play
The app is very easy to use and well designed. I have found everything I was looking for so far and have been able to learn a lot from the presentations! I will definitely use the app for a class assignment! And of course it also helps a lot as an inspiration.
Stefan SiOS user
This app is really great. There are so many study notes and help [...]. My problem subject is French, for example, and the app has so many options for help. Thanks to this app, I have improved my French. I would recommend it to anyone.
Samantha KlichAndroid user
Wow, I am really amazed. I just tried the app because I've seen it advertised many times and was absolutely stunned. This app is THE HELP you want for school and above all, it offers so many things, such as workouts and fact sheets, which have been VERY helpful to me personally.
AnnaiOS user