Population and migration are critical global processes that shape our...
Understanding Population and Migration Trends
Aabha Upadhyaya@abby_upad


1 / 10
1
of 10
Understanding Population Geography
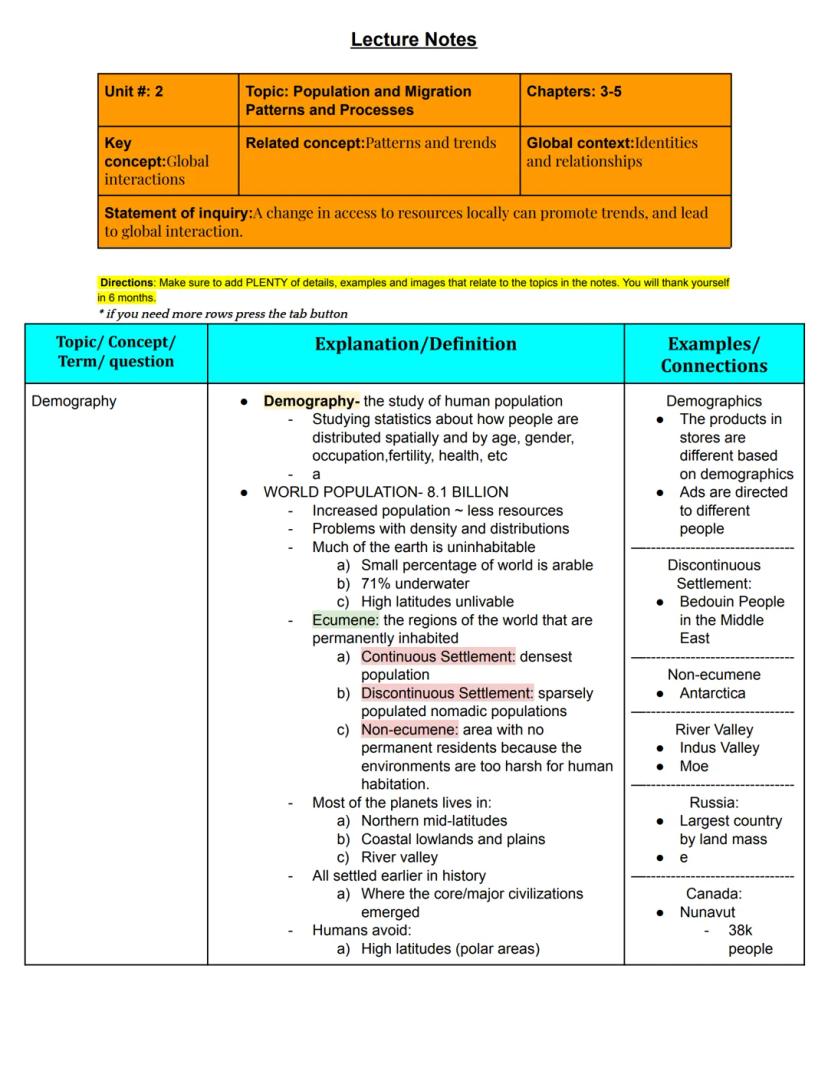
Ever wonder why people live where they do? The study of demography helps us understand how Earth's 8.1 billion people are distributed across our planet. Not all land is created equal - much of Earth is actually uninhabitable!
Only a small percentage of our planet is suitable for permanent settlement. With 71% underwater and harsh conditions in high latitudes, humans have concentrated in what geographers call the ecumene - regions that are permanently inhabited. These areas include:
- Continuous settlements: densely populated areas
- Discontinuous settlements: sparsely populated areas with nomadic groups
- Non-ecumene: areas with no permanent residents due to harsh environments
Did you know? While Russia is the largest country by land mass, most of its population lives in the European portion. Similarly, the vast majority of Canadians live within 100 miles of the US border!
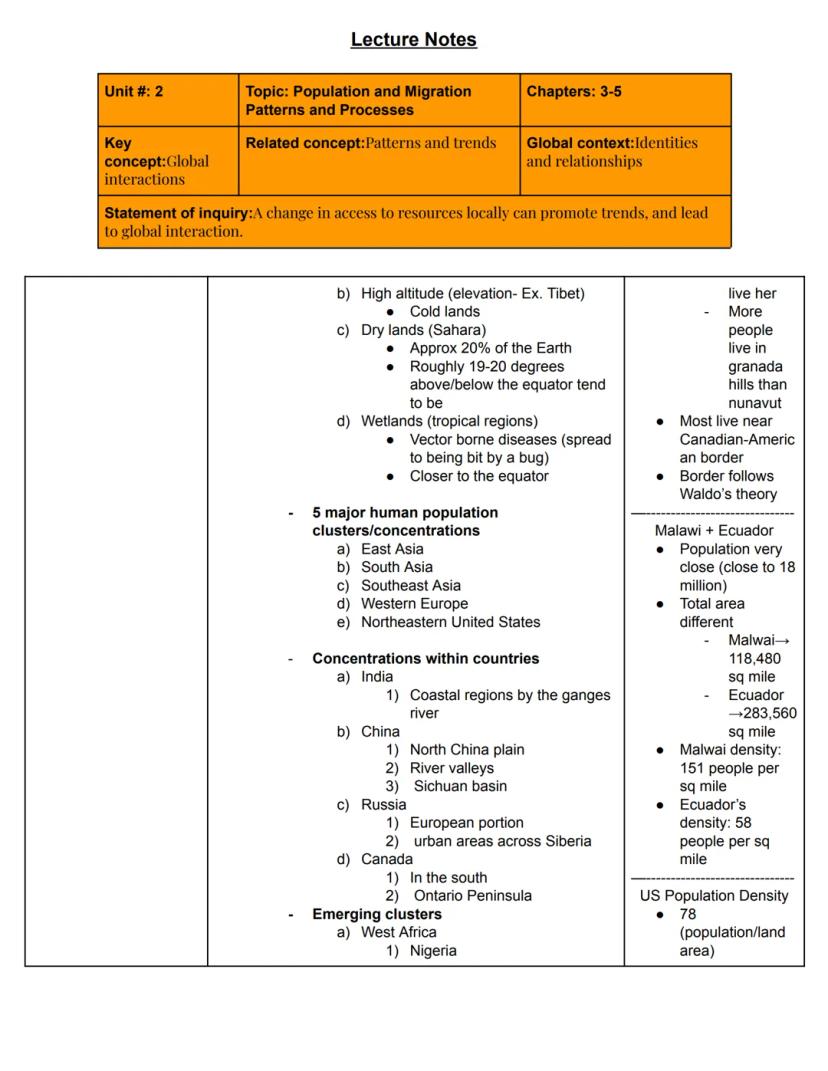
Most people prefer to live in northern mid-latitudes, coastal lowlands, and river valleys. These areas were settled earlier in history and became the core of major civilizations. Meanwhile, humans generally avoid high latitudes (polar regions), high altitudes, dry lands, and wetlands due to extreme conditions or disease risks.
2
of 10
Population Clusters and Distribution
The world's people aren't evenly spread out - they bunch up in specific regions! Five major population clusters dominate our planet:
- East Asia
- South Asia
- Southeast Asia
- Western Europe
- Northeastern United States
Even within countries, population isn't evenly distributed. In India, people concentrate along coastal regions and the Ganges River. China's population clusters in the North China Plain, river valleys, and Sichuan basin. Russia's population primarily lives in its European portion, while Canadians mostly live near the US border.
We're also seeing emerging clusters in West Africa (especially Nigeria), East Africa (Ethiopia and Lake Victoria region), and Southeastern South America around São Paulo and Buenos Aires.
Fascinating comparison: Malawi and Ecuador have nearly identical populations (around 18 million), but Ecuador is more than twice the size of Malawi. This means Malawi's population density is much higher at 151 people per square mile versus Ecuador's 58 people per square mile.
These patterns show how geography, history, resources, and climate all influence where humans choose to settle. Understanding these patterns helps explain economic development, cultural spread, and even political tensions in different regions.
3
of 10
Population Density and Sustainability
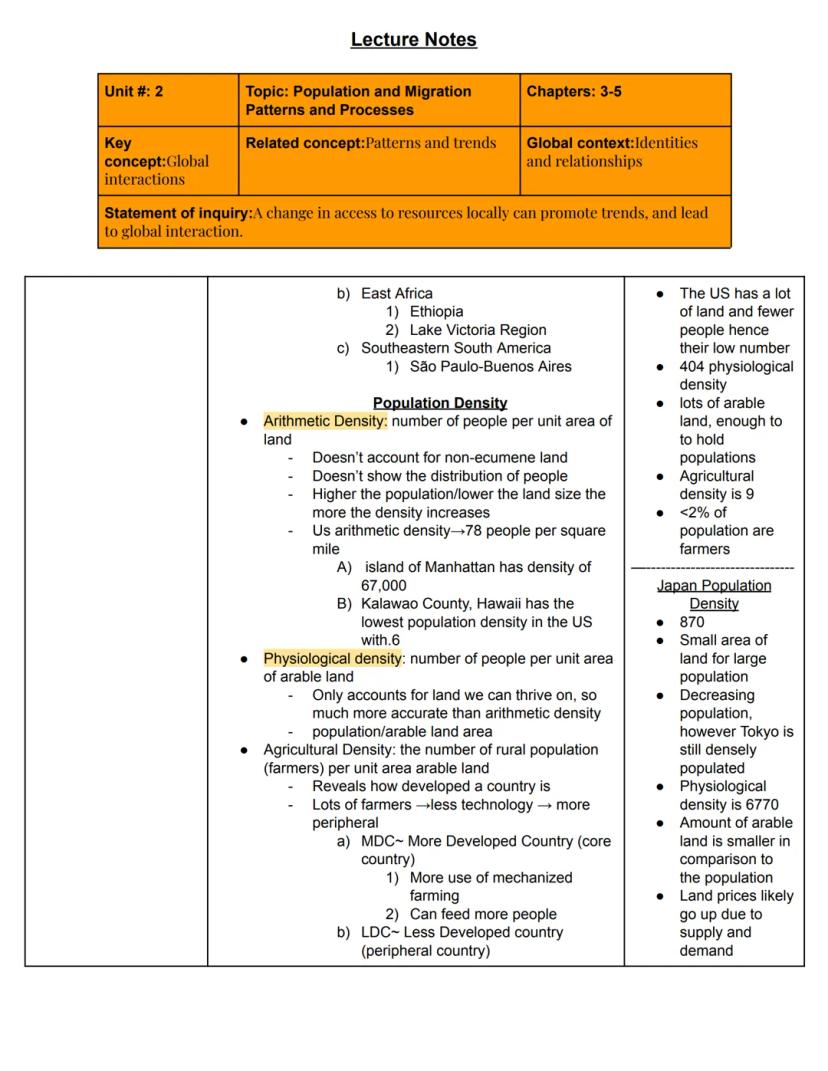
How crowded is your country? The answer depends on how you measure it! Geographers use three main ways to calculate population density:
Arithmetic density is simply the number of people divided by total land area. While easy to calculate, it doesn't account for uninhabitable land or show how people are actually distributed. The US has 78 people per square mile overall, but Manhattan has a staggering 67,000!
Physiological density measures people per unit of arable (farmable) land. This gives a clearer picture of how many people the productive land must support. Japan's physiological density of 6,770 people per square mile of arable land shows why they must import so much food.
Agricultural density counts only farmers per unit of arable land. This reveals a country's development level:
- MDCs (More Developed Countries) have low agricultural density because they use mechanized farming
- LDCs (Less Developed Countries) have higher agricultural density with more manual labor
Remember this: A high physiological density but low agricultural density typically indicates a developed nation that uses technology efficiently for farming.
These measurements help us understand a region's sustainability - its ability to maintain resource levels without harming future generations. When population exceeds an area's carrying capacity, it can lead to overcrowding, fuel shortages, water scarcity, and food insecurity.
4
of 10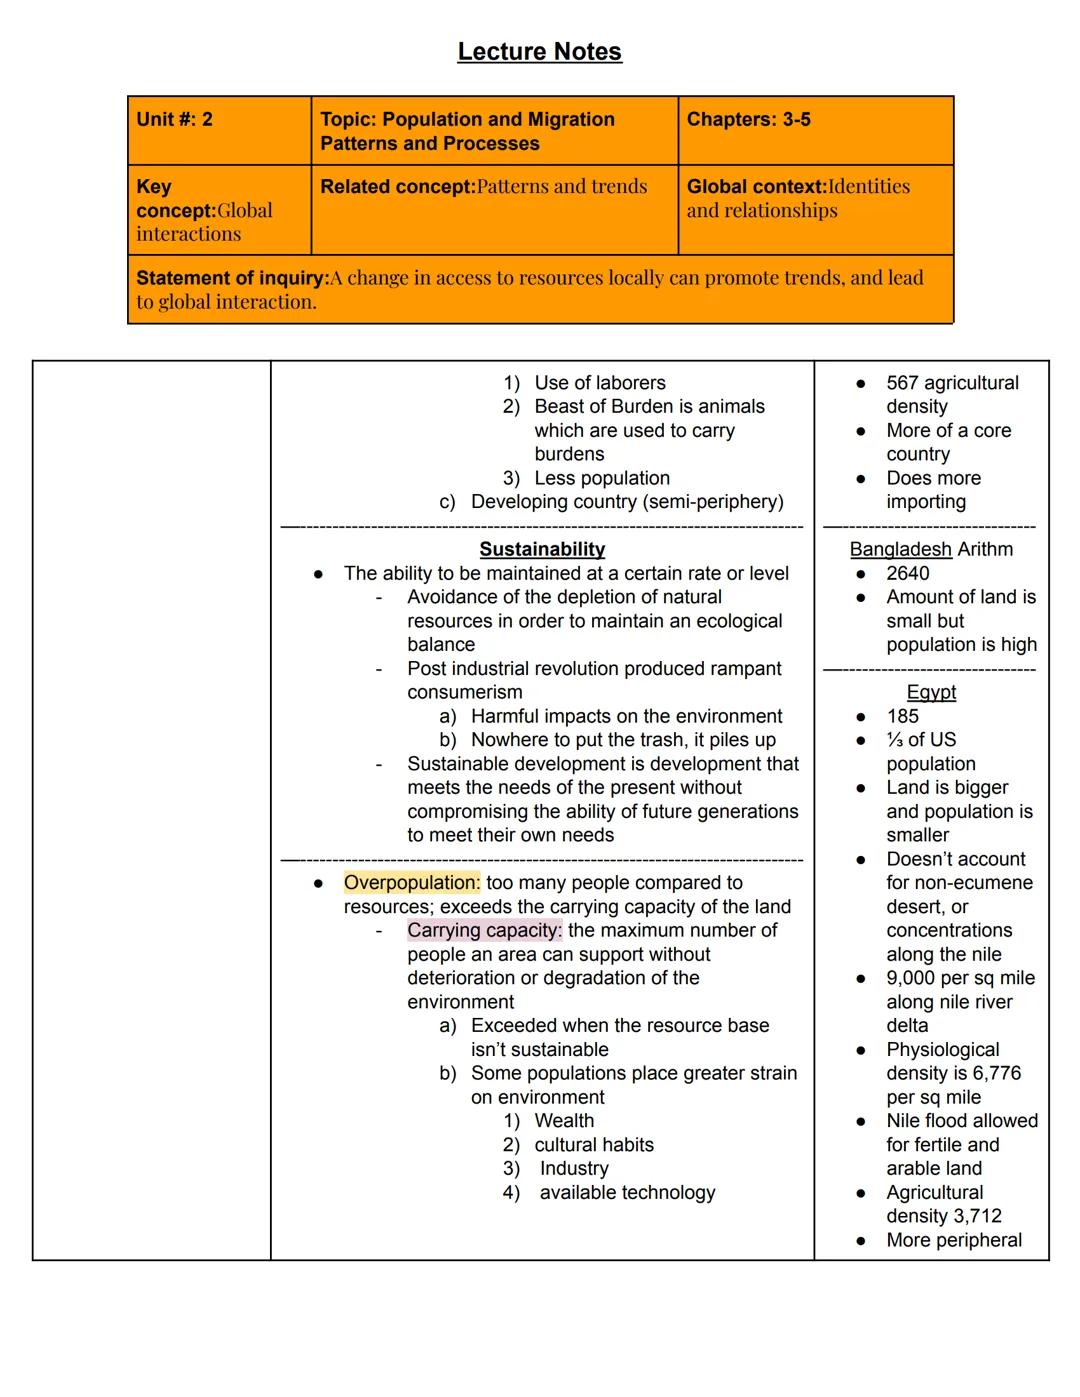
Population Growth and Sustainability
Is Earth becoming too crowded? Sustainability concerns grow as our population increases! Sustainability means maintaining ecological balance while meeting human needs without compromising future generations.
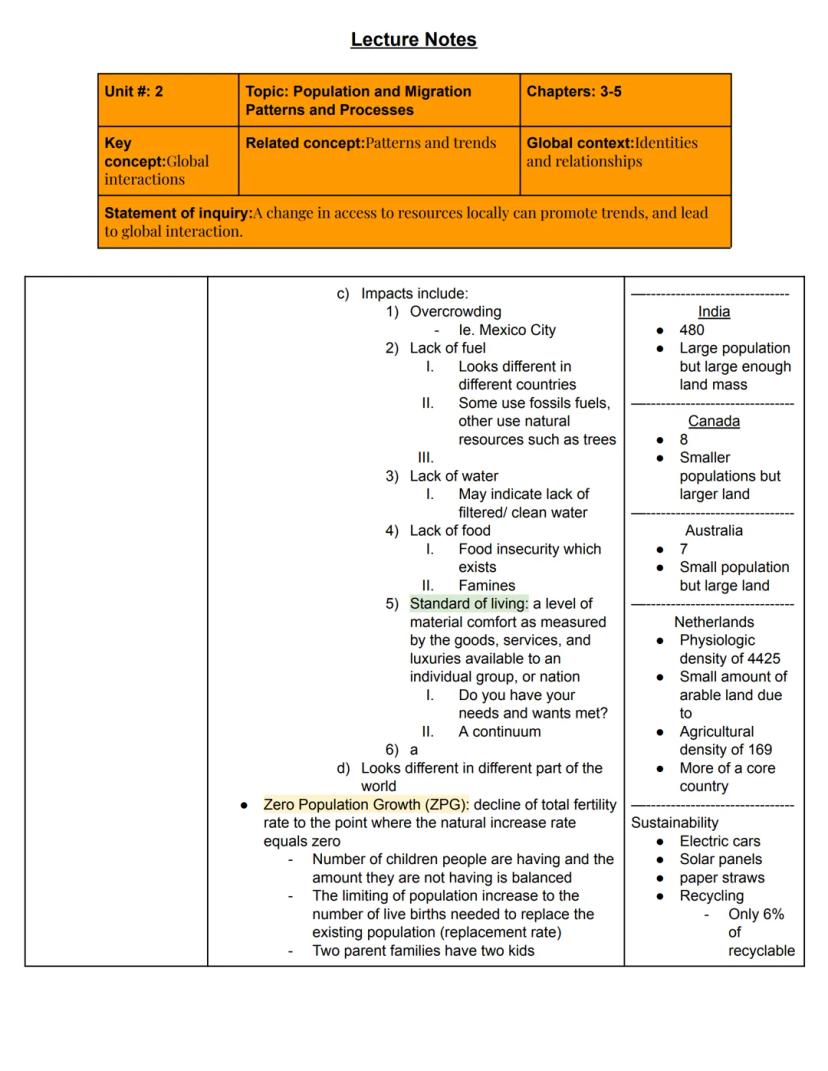
When an area has overpopulation, it exceeds the land's carrying capacity - the maximum number of people an area can support without environmental degradation. Impacts include:
- Overcrowding (like in Mexico City)
- Fuel shortages (affects different countries differently)
- Water scarcity
- Food insecurity and famines
- Declining standard of living
The consequences look different around the world. Wealthier nations might have smaller populations but consume far more resources per person.
Some regions aim for Zero Population Growth (ZPG) - when birth rates equal death rates, creating a stable population. This happens when families have just enough children to replace themselves (about 2.1 children per woman).
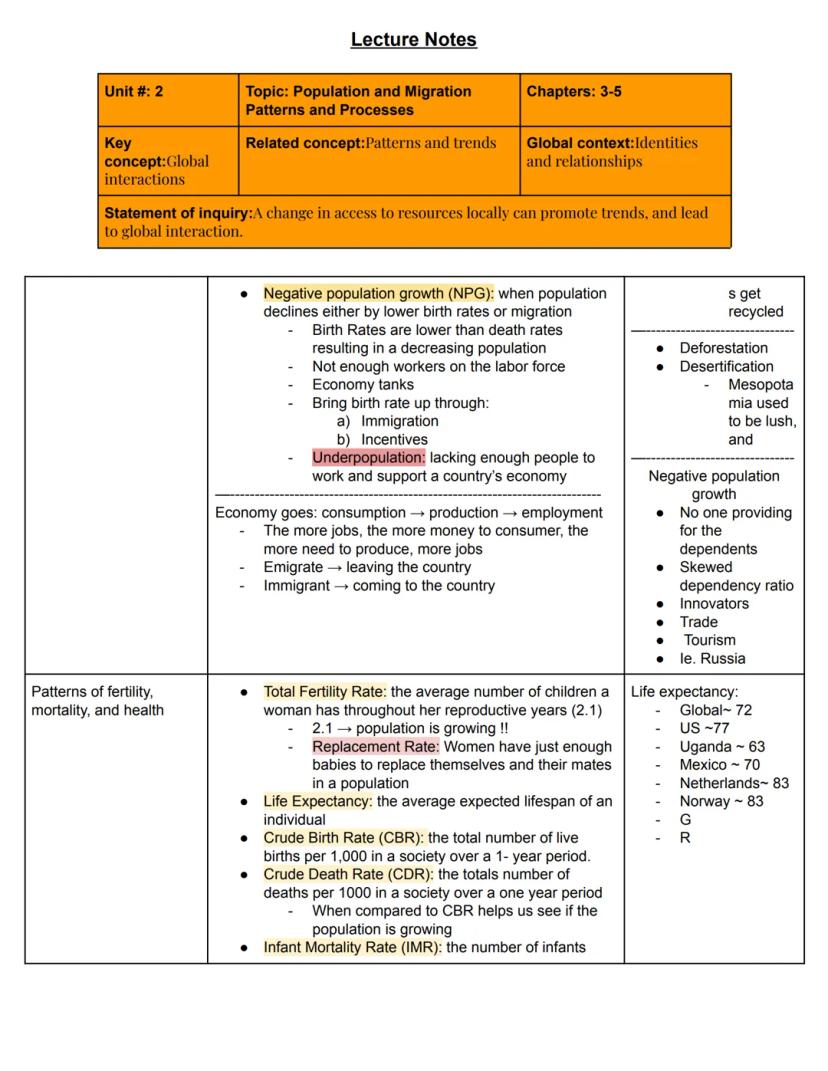
Think about this: Japan's aging population and low birth rate have led to Negative Population Growth (NPG), creating economic challenges as fewer workers must support more elderly citizens.
Countries experiencing NPG often try to increase birth rates through immigration or incentives for having children. Without enough workers, economies can stagnate and struggle to support dependent populations.
5
of 10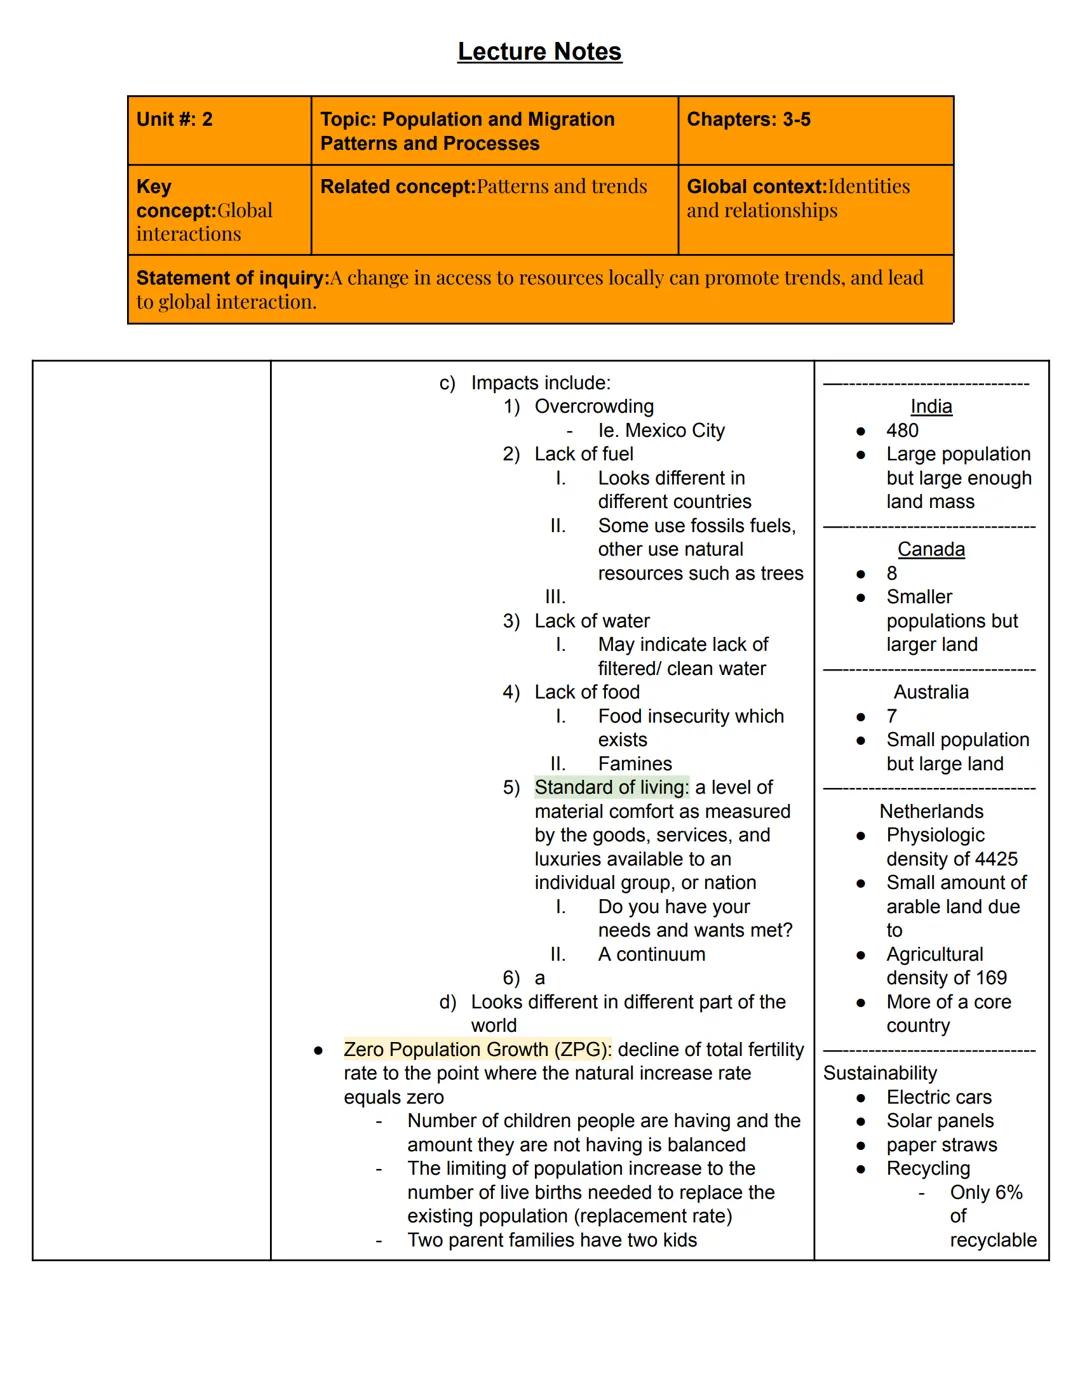
Population Measurements and Challenges
How do we track population changes? Demographers use several important measurements:
Total Fertility Rate (TFR) shows the average number of children a woman has in her lifetime. The replacement rate of 2.1 children per woman keeps a population stable.
Life expectancy varies dramatically across countries:
- Global average: 72 years
- Netherlands and Norway: 83 years
- United States: 77 years
- Uganda: 63 years
Crude Birth Rate (CBR) and Crude Death Rate (CDR) measure births and deaths per 1,000 people annually. The difference between them shows if a population is growing or shrinking.
Countries also track Infant Mortality Rate (deaths of babies under one year) and Maternal Mortality Rate (deaths during pregnancy or childbirth). These rates are typically higher in less developed countries with limited healthcare access.
Important insight: Core countries typically have much lower maternal mortality rates than peripheral countries. For example, Denmark's rate is just 5 per 100,000 births while Botswana's is 166 per 100,000.
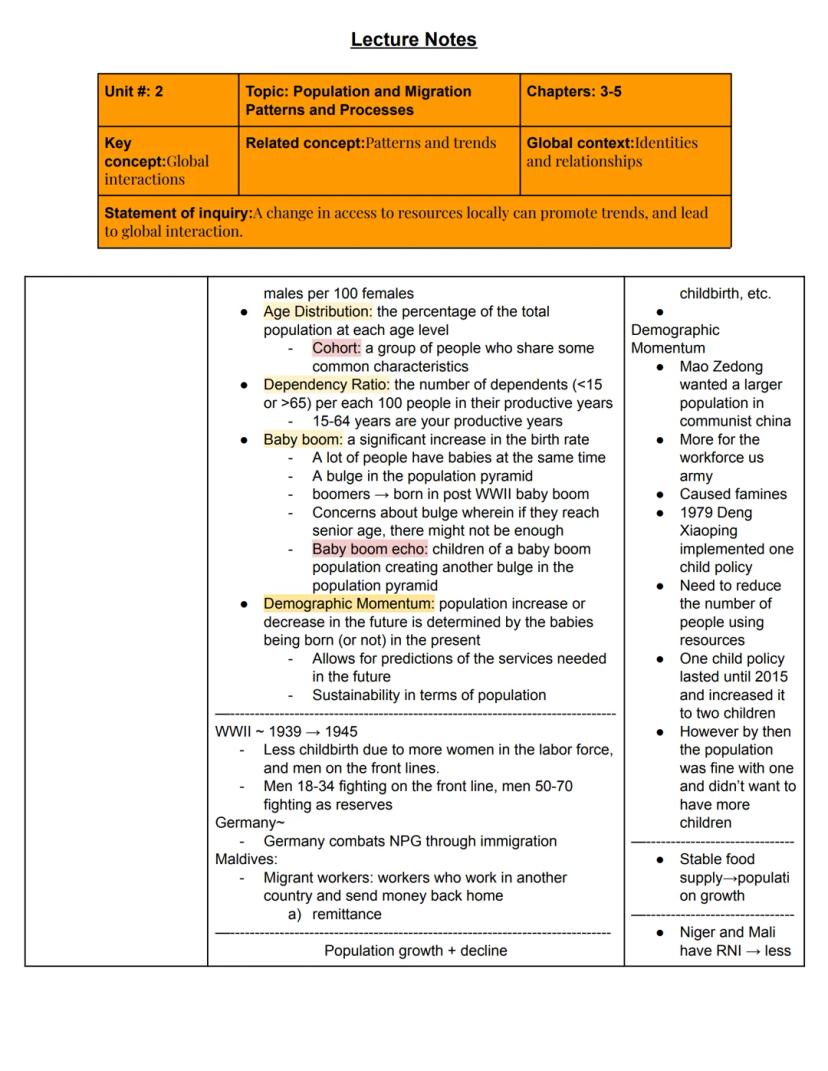
Demographic Momentum means today's birth rates determine future population trends, allowing governments to predict future service needs. China's one-child policy dramatically altered its population structure, leading to an aging population and gender imbalance.
6
of 10
Population Composition and Patterns
What does a country's population look like when broken down? Population pyramids display age and gender groups on a graph, with males typically on the left and females on the right.
The pyramid's shape reveals a lot:
- Triangle shape: High birth rates (typical of LDCs)
- Rectangular shape: Zero population growth
- Inverted triangle: Low birth rates (aging population)
Countries track important demographic measurements:
- Sex ratio: The proportion of males to females (usually per 100 females)
- Age distribution: Percentage of population at each age level
- Cohorts: Groups sharing common characteristics
- Dependency ratio: Number of dependents (under 15 or over 65) per 100 working-age people
These measurements help identify population challenges. For example, China's one-child policy created a skewed sex ratio with more males than females, as families preferred sons. This later led to marriage difficulties and demographic imbalances.
Consider this: A "baby boom" (significant birth rate increase) creates a population bulge that moves through age brackets over time. This can strain services like schools initially, then housing markets, and eventually healthcare and pension systems.
Understanding these patterns helps countries plan for future needs in education, healthcare, housing, and social services.
7
of 10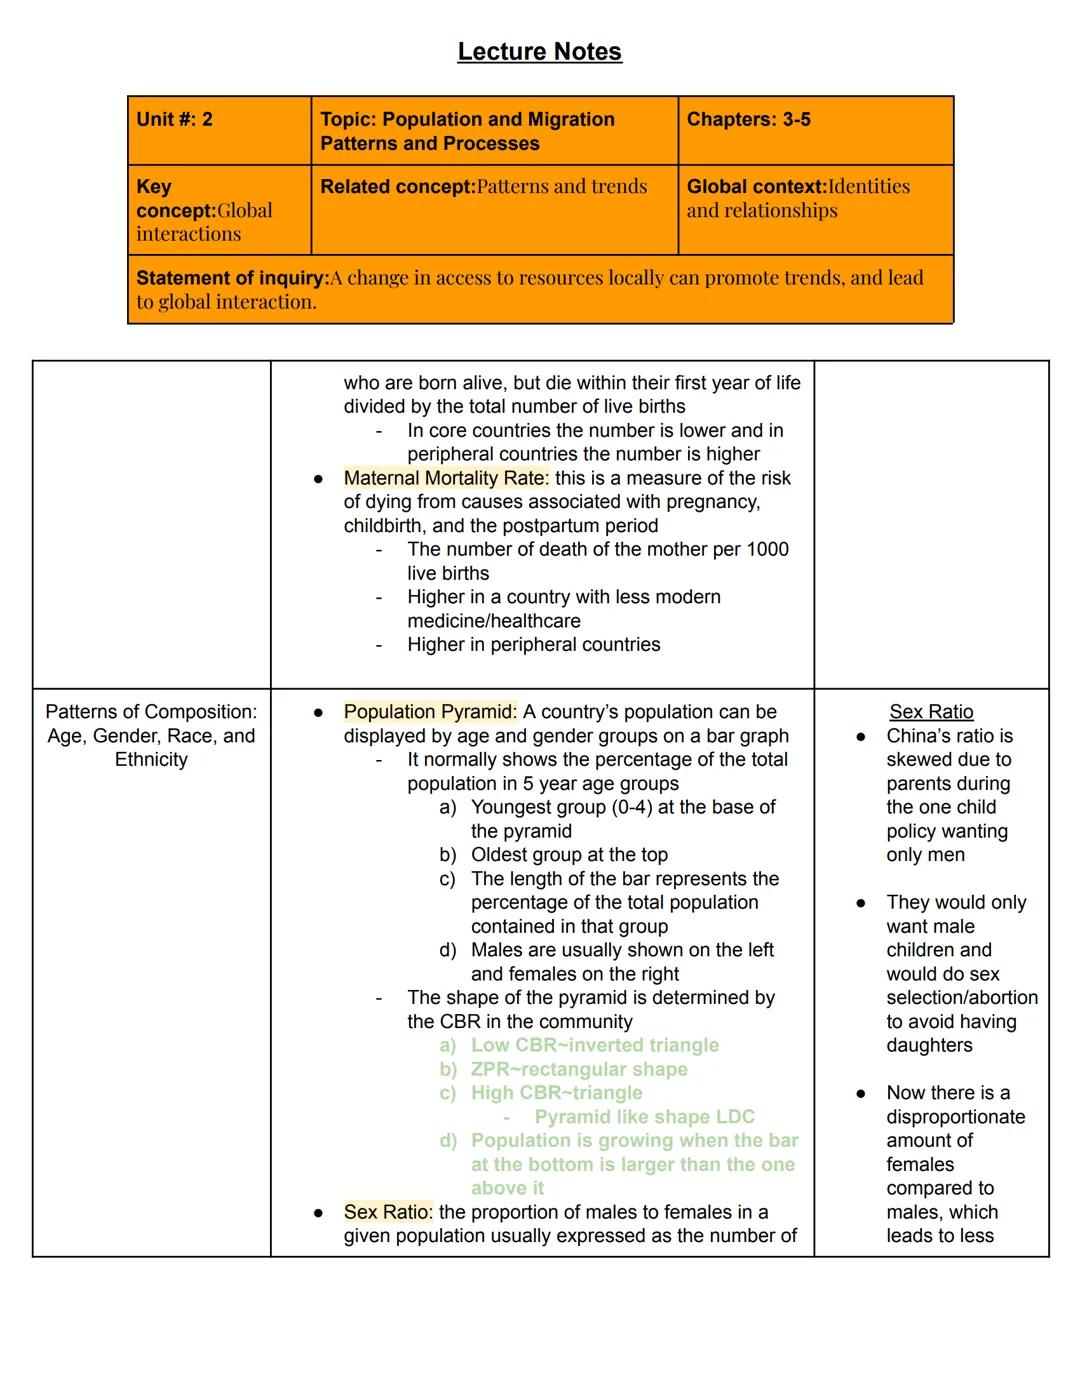
Population Growth and Theories
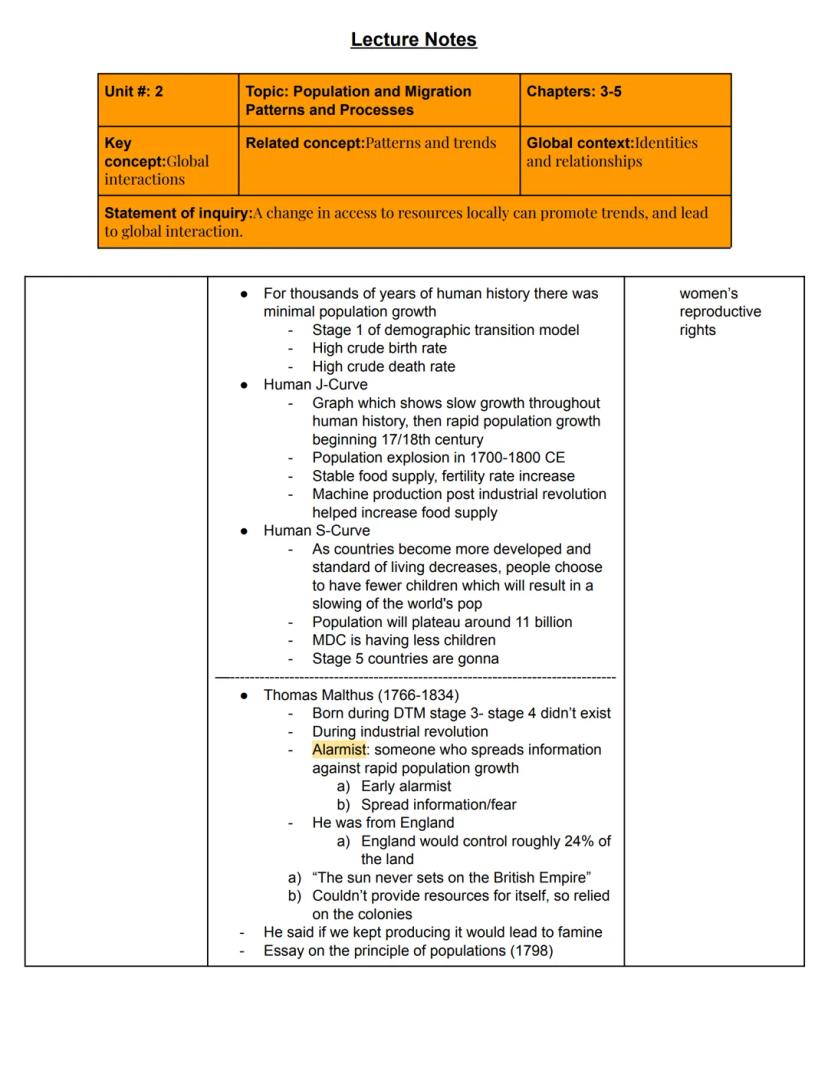
For thousands of years, human population grew very slowly - then everything changed! The Human J-Curve shows minimal growth throughout history followed by explosive growth starting in the 1700s-1800s after the Industrial Revolution.
What caused this surge? Stable food supplies, increased fertility rates, and machine production all contributed. Some scientists predict future growth will follow an S-Curve pattern, with population eventually plateauing around 11 billion as developed countries have fewer children.
Two opposing theories about population growth emerged:
Thomas Malthus , an early alarmist, warned in his "Essay on the Principle of Population" (1798) that:
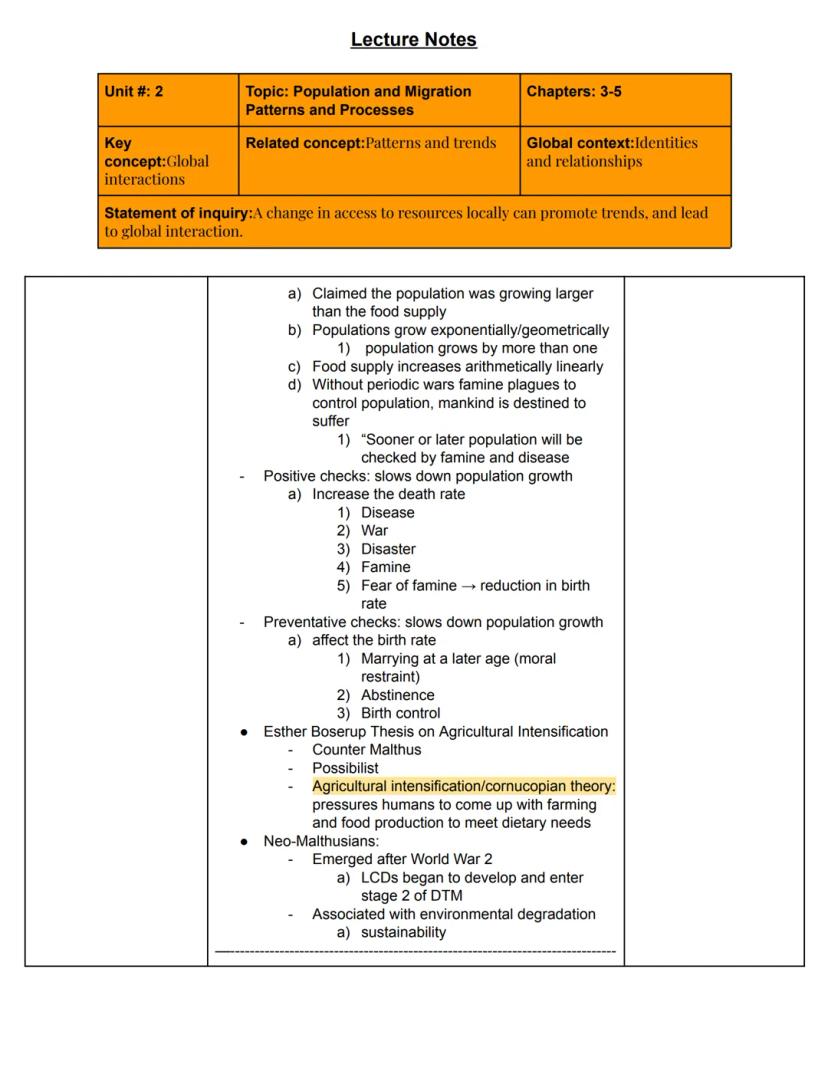
- Population grows exponentially (geometrically)
- Food supply only increases arithmetically (linearly)
- Without checks like war and famine, mankind would face disaster
Malthus identified two types of population checks:
- Positive checks: Increase death rates (disease, war, disaster, famine)
- Preventative checks: Reduce birth rates (later marriage, abstinence, birth control)
Fun fact: Malthus lived during Britain's imperial height when it controlled roughly 24% of the world's land - they said "the sun never sets on the British Empire."
In contrast, Esther Boserup developed the Agricultural Intensification Theory (also called Cornucopian Theory), arguing that population pressure actually drives humans to develop better farming techniques and food production methods to meet their needs.
8
of 10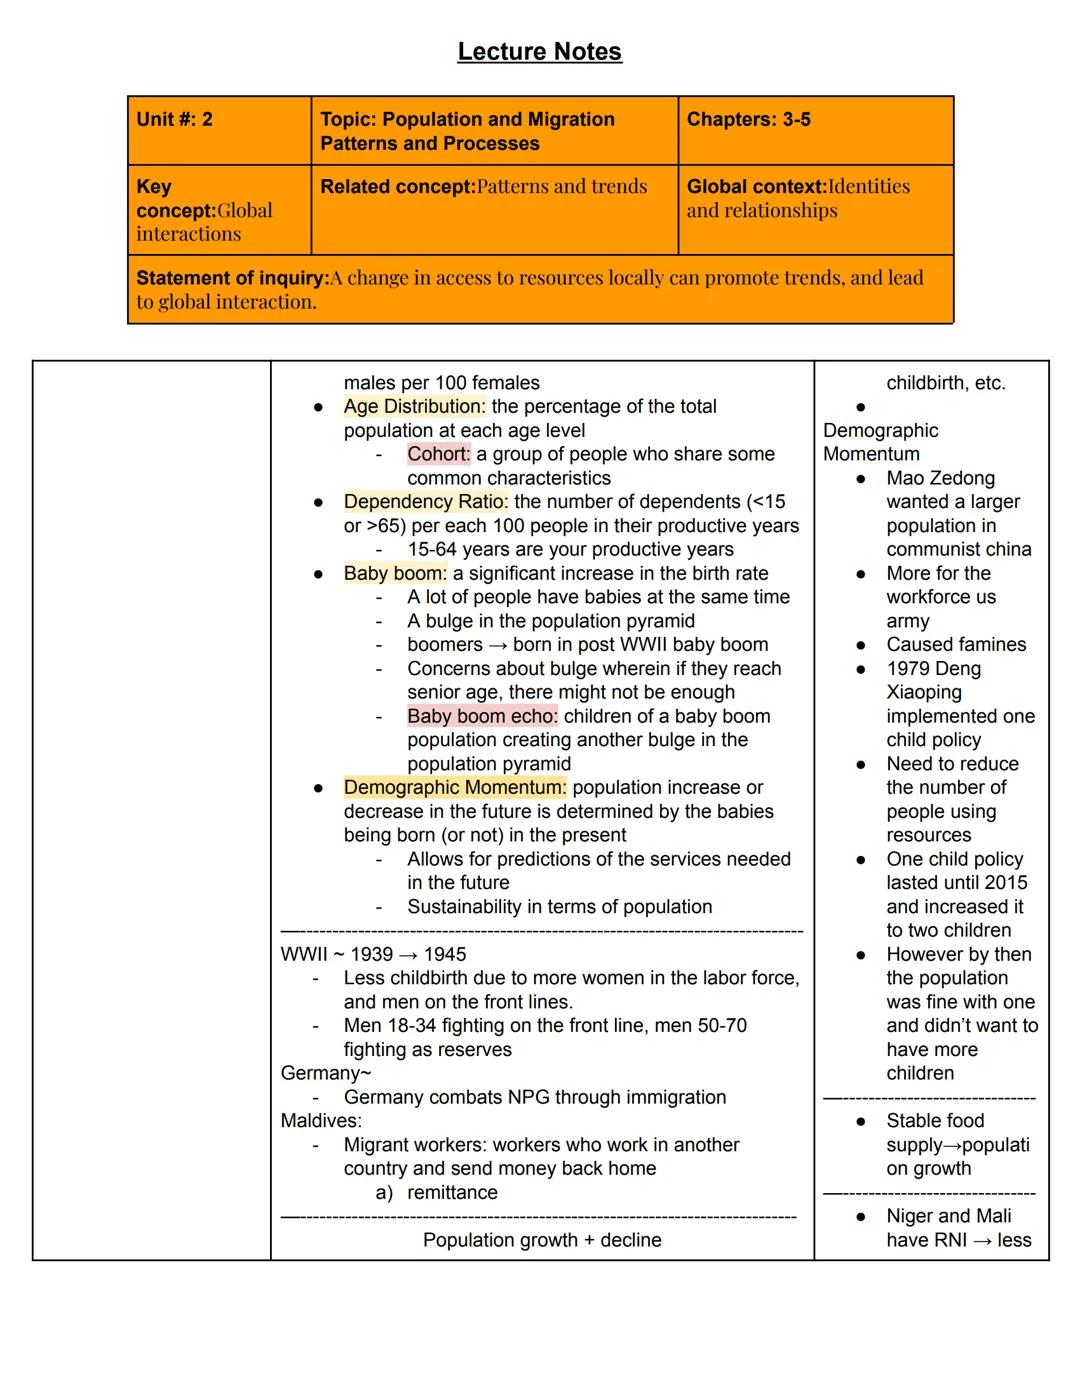
Population Transition Models
How do populations change as countries develop? The Demographic Transition Model (DTM) helps us understand this process through different stages:
Stage 1: High birth rates and high death rates (slow growth) Stage 2: High birth rates but falling death rates (rapid growth) Stage 3: Declining birth rates and low death rates (moderate growth) Stage 4: Low birth rates and low death rates (slow growth) Stage 5: Very low birth rates, possible population decline
The model has limitations - it doesn't account for migration, views development through a Western lens, and can't tell you exactly where in a stage a country falls.
Similarly, the Epidemiologic Transition Model (ETM) shows how causes of death change as countries develop:
- Early stages: High infant mortality, infectious diseases, animal attacks, famines
- Later stages: Lower infectious disease rates, higher rates of degenerative diseases like cancer and heart disease
Think about it: Both models show how development affects population. As countries become more economically advanced, they typically move through these stages in predictable patterns.
Neo-Malthusians emerged after World War II as LDCs began developing and entering Stage 2 of the DTM. They connected population growth with environmental degradation and sustainability concerns.
9
of 10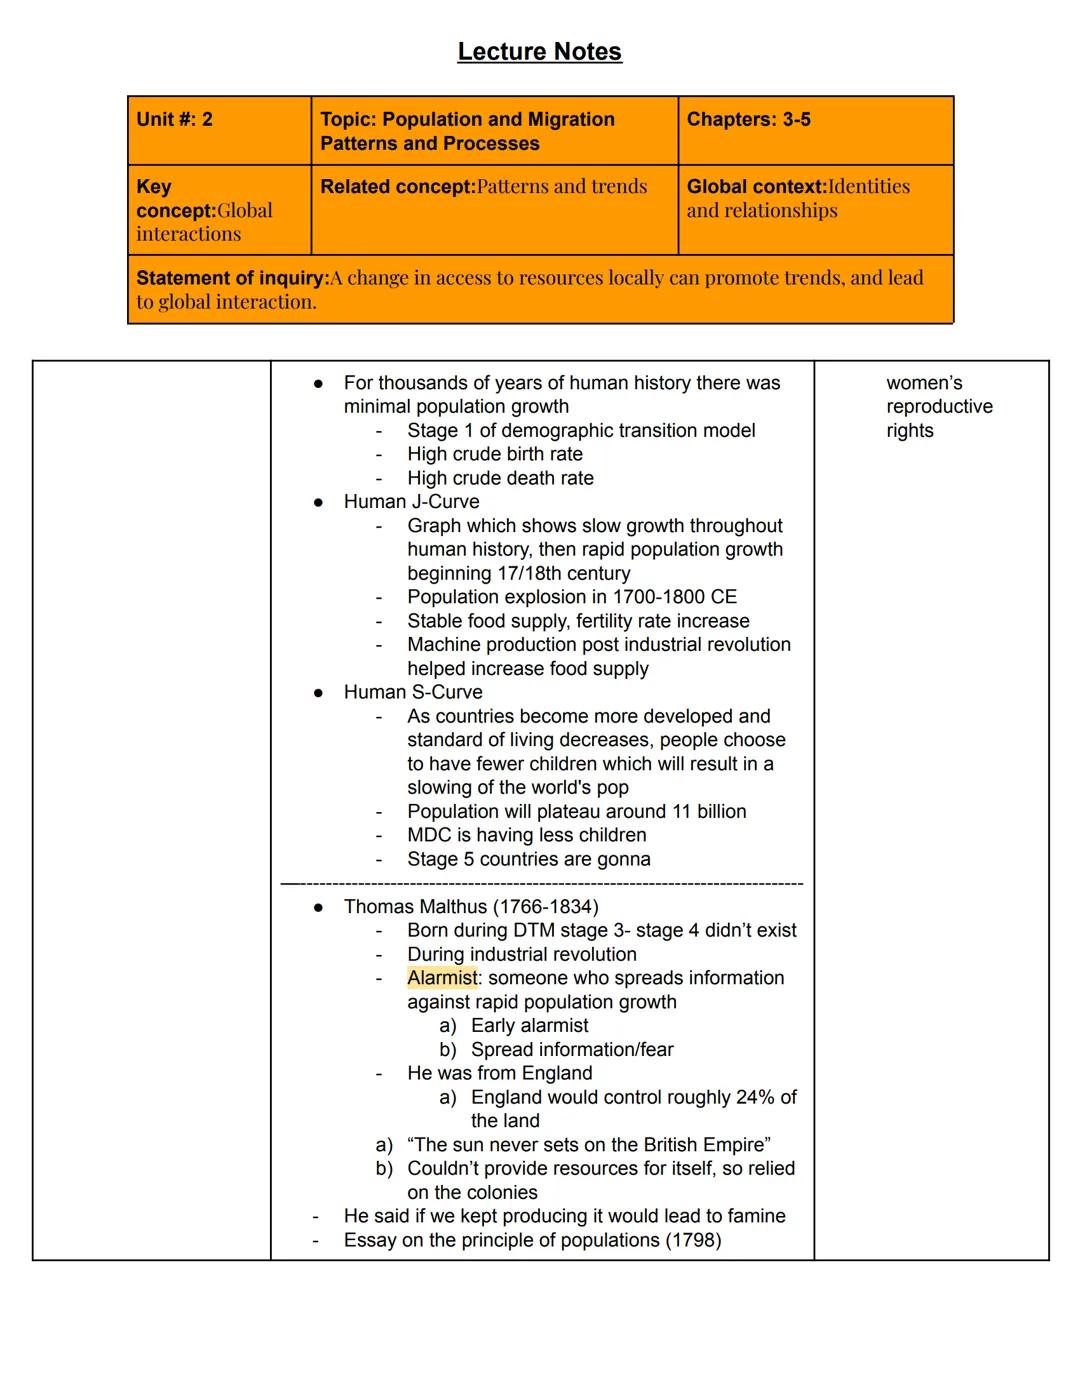
Population Growth Rates and Policies
How fast is a country's population growing? The Natural Increase Rate (NIR) tells us by calculating (CBR-CDR)/10. The lower the NIR, the slower the population growth. Most European countries have negative NIRs, leading to population decline.
We can calculate how quickly a population doubles using: 70/NIR = doubling time. Countries with high NIRs like Niger and Mali will double their populations much faster than countries with low NIRs.
The demographic equation calculates population change by considering births, deaths, and net migration. This helps governments understand their population trends and develop appropriate policies.
Population policies are measures taken by governments to modify population changes:
- Antinatalist policies discourage population growth (like China's one-child policy)
- Pronatalist policies encourage population growth through incentives like child tax credits, government daycare, and maternity leave
- Migration policies control population by limiting or encouraging immigration
Important insight: Even when China relaxed its one-child policy, many families continued having just one child because the policy had become deeply embedded in the culture.
Many religions have strong pronatalist positions, including Roman Catholicism, Judaism, Mormonism, and Amish communities. This leads to higher fertility rates in areas where these religions are concentrated.
10
of 10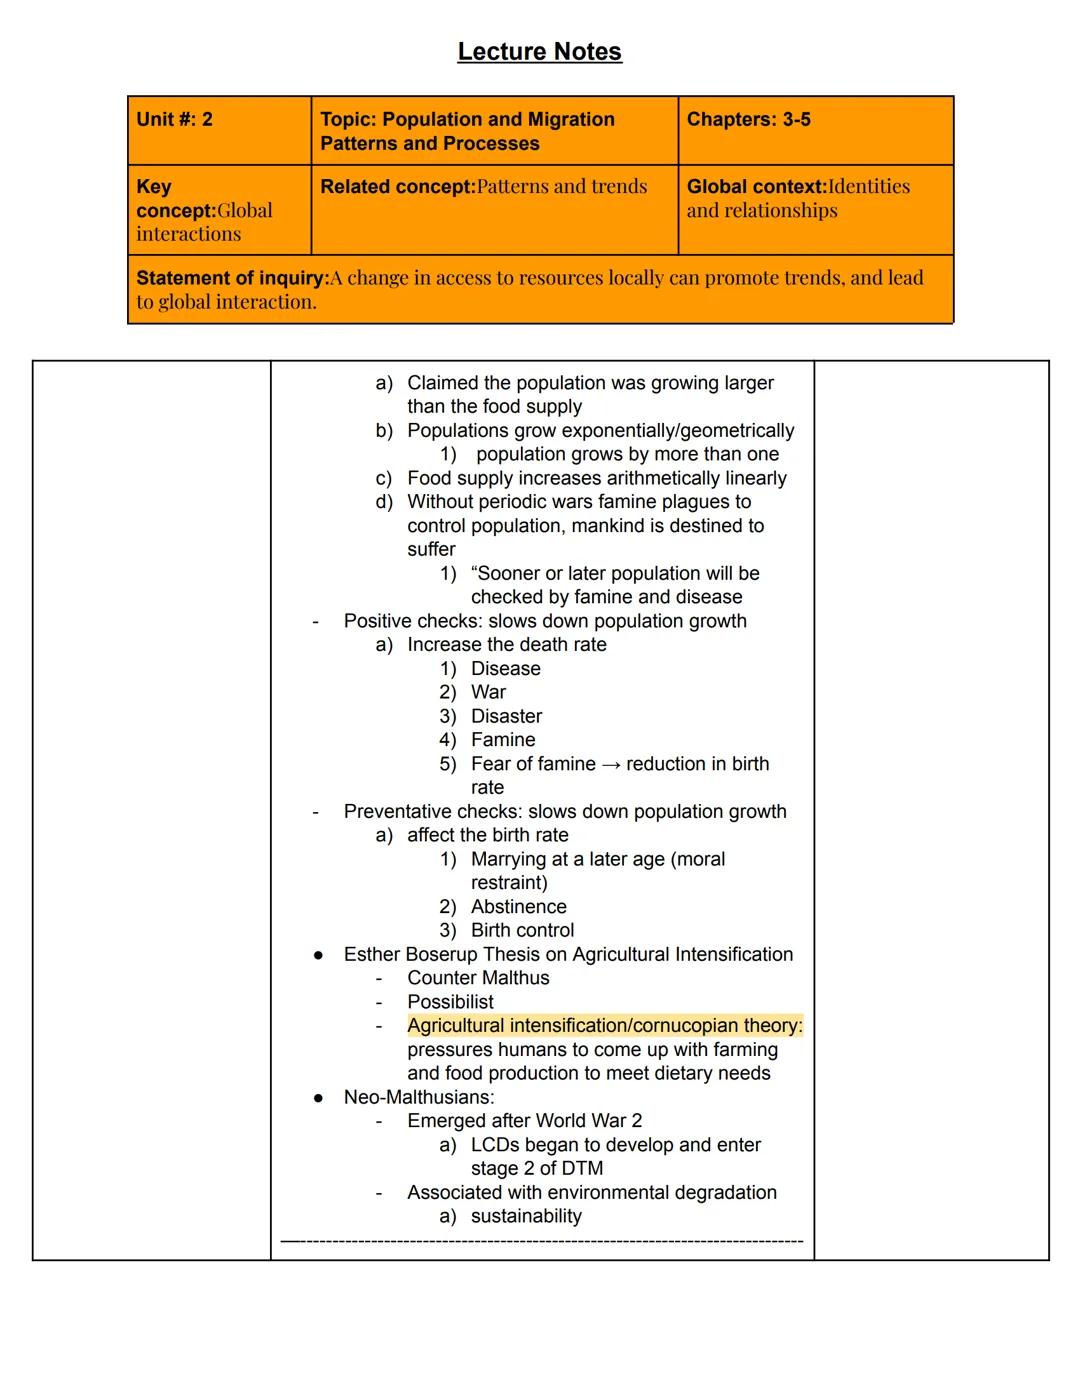
Cultural Influences on Population
How does culture affect population? The impact can be enormous! Cultural practices and beliefs often drive decisions about having children, sometimes more powerfully than government policies.
China's one-child policy provides a striking example. This strict antinatalist policy became so embedded in Chinese culture that even after it was relaxed, many families continued having only one child. The policy also reflected and reinforced cultural gender preferences:
- Strong preference for male children led to gender selection
- Millions of female fetuses were aborted
- The sex ratio became severely skewed
- Forced sterilizations and abortions were common
Shocking fact: It's estimated that the one-child policy resulted in more deaths than all major genocidal events of the 20th century combined, with propaganda and threats reinforcing its implementation.
Cultural gender preferences in countries like India and China have led to gendercide - the selection or elimination of people based on gender. UN estimates suggest around 200 million girls are "missing" in the world today due to infanticide, abandonment, or abortion based solely on gender.
This demonstrates how powerfully cultural values can shape population patterns, sometimes with devastating consequences that persist for generations.
We thought you’d never ask...
Our AI companion is specifically built for the needs of students. Based on the millions of content pieces we have on the platform we can provide truly meaningful and relevant answers to students. But its not only about answers, the companion is even more about guiding students through their daily learning challenges, with personalised study plans, quizzes or content pieces in the chat and 100% personalisation based on the students skills and developments.
You can download the app in the Google Play Store and in the Apple App Store.
That's right! Enjoy free access to study content, connect with fellow students, and get instant help – all at your fingertips.
Similar Content
Most popular content in AP Human Geography
9I
Introduction to Geographic Data
Practice identifying types of geographic data, including qualitative and quantitative sources like census data and satellite imagery.
9th5500
I
Introduction to Human-Environmental Interaction
Practice the foundational concepts of environmental determinism and possibilism and their influence on early geographic thought.
9th4520
I
Introduction to Map Properties and Scale
Practice identifying types of map distortion and calculating map scale to understand how physical reality is represented on a flat surface.
9th2860
P
Population: quiz #1!
Master the fundamentals of population with these easy flashcards designed for high school students. Explore key concepts, terms, and examples to ace your exams!
9th1910
U
Unit 2 Measuring Population Density quiz
Measuring Population Density
9th1720
A
AP HUG UNIT 1
This is a little test to help you practice for AP HUG
10th1890
I
Introduction to Geographic Data Scales
Practice identifying and differentiating between local, regional, national, and global scales of analysis using maps and data sets.
9th1810
A
APHUG Unit 1
10 questions just general info you should know if you have listened in your class :D
9th1580
Full Year APHG (Human Geography) Notes
My full Freshman year’s APHG notes compiled on a document.
9th1,920236
Most popular content
9O
Origins and Dynamics of the Columbian Exchange
Analyze the ecological and economic motivations behind the initial transfer of goods, people, and diseases between the Old and New Worlds.
9th3,1280
I
Introduction to Early Cultural Interactions
Analyze the initial social and religious encounters between Europeans, Africans, and Indigenous peoples in the colonial Americas.
9th2,7730
O
Origins of Ancient River Civilizations
Analyze the environmental factors and technological innovations that led to the rise of early states in Mesopotamia, Egypt, and the Indus Valley.
9th3,1870
M
Motivations for European Exploration
Analyze the economic, religious, and political factors that drove European powers to the Americas during the 15th and 16th centuries.
9th1,7780
F
Foundations of Ethical Guidelines in Research
Practice the core principles of the APA ethical code including informed consent, debriefing, and the role of Institutional Review Boards.
9th1,3360
I
Introduction to Native American Societies
Examine the diverse social, political, and economic structures of North American indigenous groups prior to European contact.
9th1,1100
I
Introduction to the Spanish Encomienda System
Explore the fundamental economic and social structures of the Spanish colonial system, focusing on the encomienda and the casta social hierarchy.
9th8890
I
Introduction to Biological Elements of Life
Practice identifying the essential elements including carbon, nitrogen, phosphorus, and sulfur that compose biological macromolecules.
9th1,7410
O
Origins of the Articles of Confederation
Practice identifying the motivations for a weak central government and the specific powers granted to the states under the first U.S. constitution.
9th9370
Students love us — and so will you.
4.6/5App Store
4.7/5Google Play
The app is very easy to use and well designed. I have found everything I was looking for so far and have been able to learn a lot from the presentations! I will definitely use the app for a class assignment! And of course it also helps a lot as an inspiration.
Stefan SiOS user
This app is really great. There are so many study notes and help [...]. My problem subject is French, for example, and the app has so many options for help. Thanks to this app, I have improved my French. I would recommend it to anyone.
Samantha KlichAndroid user
Wow, I am really amazed. I just tried the app because I've seen it advertised many times and was absolutely stunned. This app is THE HELP you want for school and above all, it offers so many things, such as workouts and fact sheets, which have been VERY helpful to me personally.
AnnaiOS user
Understanding Population and Migration Trends
Aabha Upadhyaya@abby_upad
Population and migration are critical global processes that shape our world. From how people are distributed across the planet to why and how they move, these patterns influence everything from economics to culture. Understanding these concepts helps us make sense...
1
of 10
Sign up to see the content. It's free!
- Access to all documents
- Improve your grades
- Join milions of students
Understanding Population Geography
Ever wonder why people live where they do? The study of demography helps us understand how Earth's 8.1 billion people are distributed across our planet. Not all land is created equal - much of Earth is actually uninhabitable!
Only a small percentage of our planet is suitable for permanent settlement. With 71% underwater and harsh conditions in high latitudes, humans have concentrated in what geographers call the ecumene - regions that are permanently inhabited. These areas include:
- Continuous settlements: densely populated areas
- Discontinuous settlements: sparsely populated areas with nomadic groups
- Non-ecumene: areas with no permanent residents due to harsh environments
Did you know? While Russia is the largest country by land mass, most of its population lives in the European portion. Similarly, the vast majority of Canadians live within 100 miles of the US border!
Most people prefer to live in northern mid-latitudes, coastal lowlands, and river valleys. These areas were settled earlier in history and became the core of major civilizations. Meanwhile, humans generally avoid high latitudes (polar regions), high altitudes, dry lands, and wetlands due to extreme conditions or disease risks.
2
of 10Sign up to see the content. It's free!
- Access to all documents
- Improve your grades
- Join milions of students
Population Clusters and Distribution
The world's people aren't evenly spread out - they bunch up in specific regions! Five major population clusters dominate our planet:
- East Asia
- South Asia
- Southeast Asia
- Western Europe
- Northeastern United States
Even within countries, population isn't evenly distributed. In India, people concentrate along coastal regions and the Ganges River. China's population clusters in the North China Plain, river valleys, and Sichuan basin. Russia's population primarily lives in its European portion, while Canadians mostly live near the US border.
We're also seeing emerging clusters in West Africa (especially Nigeria), East Africa (Ethiopia and Lake Victoria region), and Southeastern South America around São Paulo and Buenos Aires.
Fascinating comparison: Malawi and Ecuador have nearly identical populations (around 18 million), but Ecuador is more than twice the size of Malawi. This means Malawi's population density is much higher at 151 people per square mile versus Ecuador's 58 people per square mile.
These patterns show how geography, history, resources, and climate all influence where humans choose to settle. Understanding these patterns helps explain economic development, cultural spread, and even political tensions in different regions.
3
of 10Sign up to see the content. It's free!
- Access to all documents
- Improve your grades
- Join milions of students
Population Density and Sustainability
How crowded is your country? The answer depends on how you measure it! Geographers use three main ways to calculate population density:
Arithmetic density is simply the number of people divided by total land area. While easy to calculate, it doesn't account for uninhabitable land or show how people are actually distributed. The US has 78 people per square mile overall, but Manhattan has a staggering 67,000!
Physiological density measures people per unit of arable (farmable) land. This gives a clearer picture of how many people the productive land must support. Japan's physiological density of 6,770 people per square mile of arable land shows why they must import so much food.
Agricultural density counts only farmers per unit of arable land. This reveals a country's development level:
- MDCs (More Developed Countries) have low agricultural density because they use mechanized farming
- LDCs (Less Developed Countries) have higher agricultural density with more manual labor
Remember this: A high physiological density but low agricultural density typically indicates a developed nation that uses technology efficiently for farming.
These measurements help us understand a region's sustainability - its ability to maintain resource levels without harming future generations. When population exceeds an area's carrying capacity, it can lead to overcrowding, fuel shortages, water scarcity, and food insecurity.
4
of 10Sign up to see the content. It's free!
- Access to all documents
- Improve your grades
- Join milions of students
Population Growth and Sustainability
Is Earth becoming too crowded? Sustainability concerns grow as our population increases! Sustainability means maintaining ecological balance while meeting human needs without compromising future generations.
When an area has overpopulation, it exceeds the land's carrying capacity - the maximum number of people an area can support without environmental degradation. Impacts include:
- Overcrowding (like in Mexico City)
- Fuel shortages (affects different countries differently)
- Water scarcity
- Food insecurity and famines
- Declining standard of living
The consequences look different around the world. Wealthier nations might have smaller populations but consume far more resources per person.
Some regions aim for Zero Population Growth (ZPG) - when birth rates equal death rates, creating a stable population. This happens when families have just enough children to replace themselves (about 2.1 children per woman).
Think about this: Japan's aging population and low birth rate have led to Negative Population Growth (NPG), creating economic challenges as fewer workers must support more elderly citizens.
Countries experiencing NPG often try to increase birth rates through immigration or incentives for having children. Without enough workers, economies can stagnate and struggle to support dependent populations.
5
of 10Sign up to see the content. It's free!
- Access to all documents
- Improve your grades
- Join milions of students
Population Measurements and Challenges
How do we track population changes? Demographers use several important measurements:
Total Fertility Rate (TFR) shows the average number of children a woman has in her lifetime. The replacement rate of 2.1 children per woman keeps a population stable.
Life expectancy varies dramatically across countries:
- Global average: 72 years
- Netherlands and Norway: 83 years
- United States: 77 years
- Uganda: 63 years
Crude Birth Rate (CBR) and Crude Death Rate (CDR) measure births and deaths per 1,000 people annually. The difference between them shows if a population is growing or shrinking.
Countries also track Infant Mortality Rate (deaths of babies under one year) and Maternal Mortality Rate (deaths during pregnancy or childbirth). These rates are typically higher in less developed countries with limited healthcare access.
Important insight: Core countries typically have much lower maternal mortality rates than peripheral countries. For example, Denmark's rate is just 5 per 100,000 births while Botswana's is 166 per 100,000.
Demographic Momentum means today's birth rates determine future population trends, allowing governments to predict future service needs. China's one-child policy dramatically altered its population structure, leading to an aging population and gender imbalance.
6
of 10Sign up to see the content. It's free!
- Access to all documents
- Improve your grades
- Join milions of students
Population Composition and Patterns
What does a country's population look like when broken down? Population pyramids display age and gender groups on a graph, with males typically on the left and females on the right.
The pyramid's shape reveals a lot:
- Triangle shape: High birth rates (typical of LDCs)
- Rectangular shape: Zero population growth
- Inverted triangle: Low birth rates (aging population)
Countries track important demographic measurements:
- Sex ratio: The proportion of males to females (usually per 100 females)
- Age distribution: Percentage of population at each age level
- Cohorts: Groups sharing common characteristics
- Dependency ratio: Number of dependents (under 15 or over 65) per 100 working-age people
These measurements help identify population challenges. For example, China's one-child policy created a skewed sex ratio with more males than females, as families preferred sons. This later led to marriage difficulties and demographic imbalances.
Consider this: A "baby boom" (significant birth rate increase) creates a population bulge that moves through age brackets over time. This can strain services like schools initially, then housing markets, and eventually healthcare and pension systems.
Understanding these patterns helps countries plan for future needs in education, healthcare, housing, and social services.
7
of 10Sign up to see the content. It's free!
- Access to all documents
- Improve your grades
- Join milions of students
Population Growth and Theories
For thousands of years, human population grew very slowly - then everything changed! The Human J-Curve shows minimal growth throughout history followed by explosive growth starting in the 1700s-1800s after the Industrial Revolution.
What caused this surge? Stable food supplies, increased fertility rates, and machine production all contributed. Some scientists predict future growth will follow an S-Curve pattern, with population eventually plateauing around 11 billion as developed countries have fewer children.
Two opposing theories about population growth emerged:
Thomas Malthus , an early alarmist, warned in his "Essay on the Principle of Population" (1798) that:
- Population grows exponentially (geometrically)
- Food supply only increases arithmetically (linearly)
- Without checks like war and famine, mankind would face disaster
Malthus identified two types of population checks:
- Positive checks: Increase death rates (disease, war, disaster, famine)
- Preventative checks: Reduce birth rates (later marriage, abstinence, birth control)
Fun fact: Malthus lived during Britain's imperial height when it controlled roughly 24% of the world's land - they said "the sun never sets on the British Empire."
In contrast, Esther Boserup developed the Agricultural Intensification Theory (also called Cornucopian Theory), arguing that population pressure actually drives humans to develop better farming techniques and food production methods to meet their needs.
8
of 10Sign up to see the content. It's free!
- Access to all documents
- Improve your grades
- Join milions of students
Population Transition Models
How do populations change as countries develop? The Demographic Transition Model (DTM) helps us understand this process through different stages:
Stage 1: High birth rates and high death rates (slow growth) Stage 2: High birth rates but falling death rates (rapid growth) Stage 3: Declining birth rates and low death rates (moderate growth) Stage 4: Low birth rates and low death rates (slow growth) Stage 5: Very low birth rates, possible population decline
The model has limitations - it doesn't account for migration, views development through a Western lens, and can't tell you exactly where in a stage a country falls.
Similarly, the Epidemiologic Transition Model (ETM) shows how causes of death change as countries develop:
- Early stages: High infant mortality, infectious diseases, animal attacks, famines
- Later stages: Lower infectious disease rates, higher rates of degenerative diseases like cancer and heart disease
Think about it: Both models show how development affects population. As countries become more economically advanced, they typically move through these stages in predictable patterns.
Neo-Malthusians emerged after World War II as LDCs began developing and entering Stage 2 of the DTM. They connected population growth with environmental degradation and sustainability concerns.
9
of 10Sign up to see the content. It's free!
- Access to all documents
- Improve your grades
- Join milions of students
Population Growth Rates and Policies
How fast is a country's population growing? The Natural Increase Rate (NIR) tells us by calculating (CBR-CDR)/10. The lower the NIR, the slower the population growth. Most European countries have negative NIRs, leading to population decline.
We can calculate how quickly a population doubles using: 70/NIR = doubling time. Countries with high NIRs like Niger and Mali will double their populations much faster than countries with low NIRs.
The demographic equation calculates population change by considering births, deaths, and net migration. This helps governments understand their population trends and develop appropriate policies.
Population policies are measures taken by governments to modify population changes:
- Antinatalist policies discourage population growth (like China's one-child policy)
- Pronatalist policies encourage population growth through incentives like child tax credits, government daycare, and maternity leave
- Migration policies control population by limiting or encouraging immigration
Important insight: Even when China relaxed its one-child policy, many families continued having just one child because the policy had become deeply embedded in the culture.
Many religions have strong pronatalist positions, including Roman Catholicism, Judaism, Mormonism, and Amish communities. This leads to higher fertility rates in areas where these religions are concentrated.
10
of 10Sign up to see the content. It's free!
- Access to all documents
- Improve your grades
- Join milions of students
Cultural Influences on Population
How does culture affect population? The impact can be enormous! Cultural practices and beliefs often drive decisions about having children, sometimes more powerfully than government policies.
China's one-child policy provides a striking example. This strict antinatalist policy became so embedded in Chinese culture that even after it was relaxed, many families continued having only one child. The policy also reflected and reinforced cultural gender preferences:
- Strong preference for male children led to gender selection
- Millions of female fetuses were aborted
- The sex ratio became severely skewed
- Forced sterilizations and abortions were common
Shocking fact: It's estimated that the one-child policy resulted in more deaths than all major genocidal events of the 20th century combined, with propaganda and threats reinforcing its implementation.
Cultural gender preferences in countries like India and China have led to gendercide - the selection or elimination of people based on gender. UN estimates suggest around 200 million girls are "missing" in the world today due to infanticide, abandonment, or abortion based solely on gender.
This demonstrates how powerfully cultural values can shape population patterns, sometimes with devastating consequences that persist for generations.
We thought you’d never ask...
Our AI companion is specifically built for the needs of students. Based on the millions of content pieces we have on the platform we can provide truly meaningful and relevant answers to students. But its not only about answers, the companion is even more about guiding students through their daily learning challenges, with personalised study plans, quizzes or content pieces in the chat and 100% personalisation based on the students skills and developments.
You can download the app in the Google Play Store and in the Apple App Store.
That's right! Enjoy free access to study content, connect with fellow students, and get instant help – all at your fingertips.
Similar Content
Most popular content in AP Human Geography
9I
Introduction to Geographic Data
Practice identifying types of geographic data, including qualitative and quantitative sources like census data and satellite imagery.
9th5500
I
Introduction to Human-Environmental Interaction
Practice the foundational concepts of environmental determinism and possibilism and their influence on early geographic thought.
9th4520
I
Introduction to Map Properties and Scale
Practice identifying types of map distortion and calculating map scale to understand how physical reality is represented on a flat surface.
9th2860
P
Population: quiz #1!
Master the fundamentals of population with these easy flashcards designed for high school students. Explore key concepts, terms, and examples to ace your exams!
9th1910
U
Unit 2 Measuring Population Density quiz
Measuring Population Density
9th1720
A
AP HUG UNIT 1
This is a little test to help you practice for AP HUG
10th1890
I
Introduction to Geographic Data Scales
Practice identifying and differentiating between local, regional, national, and global scales of analysis using maps and data sets.
9th1810
A
APHUG Unit 1
10 questions just general info you should know if you have listened in your class :D
9th1580
Full Year APHG (Human Geography) Notes
My full Freshman year’s APHG notes compiled on a document.
9th1,920236
Most popular content
9O
Origins and Dynamics of the Columbian Exchange
Analyze the ecological and economic motivations behind the initial transfer of goods, people, and diseases between the Old and New Worlds.
9th3,1280
I
Introduction to Early Cultural Interactions
Analyze the initial social and religious encounters between Europeans, Africans, and Indigenous peoples in the colonial Americas.
9th2,7730
O
Origins of Ancient River Civilizations
Analyze the environmental factors and technological innovations that led to the rise of early states in Mesopotamia, Egypt, and the Indus Valley.
9th3,1870
M
Motivations for European Exploration
Analyze the economic, religious, and political factors that drove European powers to the Americas during the 15th and 16th centuries.
9th1,7780
F
Foundations of Ethical Guidelines in Research
Practice the core principles of the APA ethical code including informed consent, debriefing, and the role of Institutional Review Boards.
9th1,3360
I
Introduction to Native American Societies
Examine the diverse social, political, and economic structures of North American indigenous groups prior to European contact.
9th1,1100
I
Introduction to the Spanish Encomienda System
Explore the fundamental economic and social structures of the Spanish colonial system, focusing on the encomienda and the casta social hierarchy.
9th8890
I
Introduction to Biological Elements of Life
Practice identifying the essential elements including carbon, nitrogen, phosphorus, and sulfur that compose biological macromolecules.
9th1,7410
O
Origins of the Articles of Confederation
Practice identifying the motivations for a weak central government and the specific powers granted to the states under the first U.S. constitution.
9th9370
Students love us — and so will you.
4.6/5App Store
4.7/5Google Play
The app is very easy to use and well designed. I have found everything I was looking for so far and have been able to learn a lot from the presentations! I will definitely use the app for a class assignment! And of course it also helps a lot as an inspiration.
Stefan SiOS user
This app is really great. There are so many study notes and help [...]. My problem subject is French, for example, and the app has so many options for help. Thanks to this app, I have improved my French. I would recommend it to anyone.
Samantha KlichAndroid user
Wow, I am really amazed. I just tried the app because I've seen it advertised many times and was absolutely stunned. This app is THE HELP you want for school and above all, it offers so many things, such as workouts and fact sheets, which have been VERY helpful to me personally.
AnnaiOS user