Population geography explores how humans are distributed across our planet...
Week 5: Exploring Demography Concepts
Y
Yessica Ramirez@essicaamirez_sjkhsjq


1 / 10
1
of 10
Population Geography Fundamentals
Population geography examines where people live and why certain areas become densely populated while others remain sparsely inhabited. Demographers analyze population using two main tools: census data (complete population counts) and estimations (calculated projections for areas where complete counts aren't feasible).
Despite Earth's vast landmass, humans aren't evenly distributed across it. Remarkably, about 90% of the world's population occupies just 20% of the available land surface. This concentration reflects both natural environmental factors and human historical patterns.
The United Nations estimates our global population reached 8 billion in November 2022 and projects growth to 10.4 billion by the 2080s. Understanding these numbers helps governments and planners make informed decisions about resources, infrastructure, and services.
Did you know? Census data isn't just for counting people—it collects crucial socioeconomic information that governments use for everything from building schools to planning healthcare systems.
2
of 10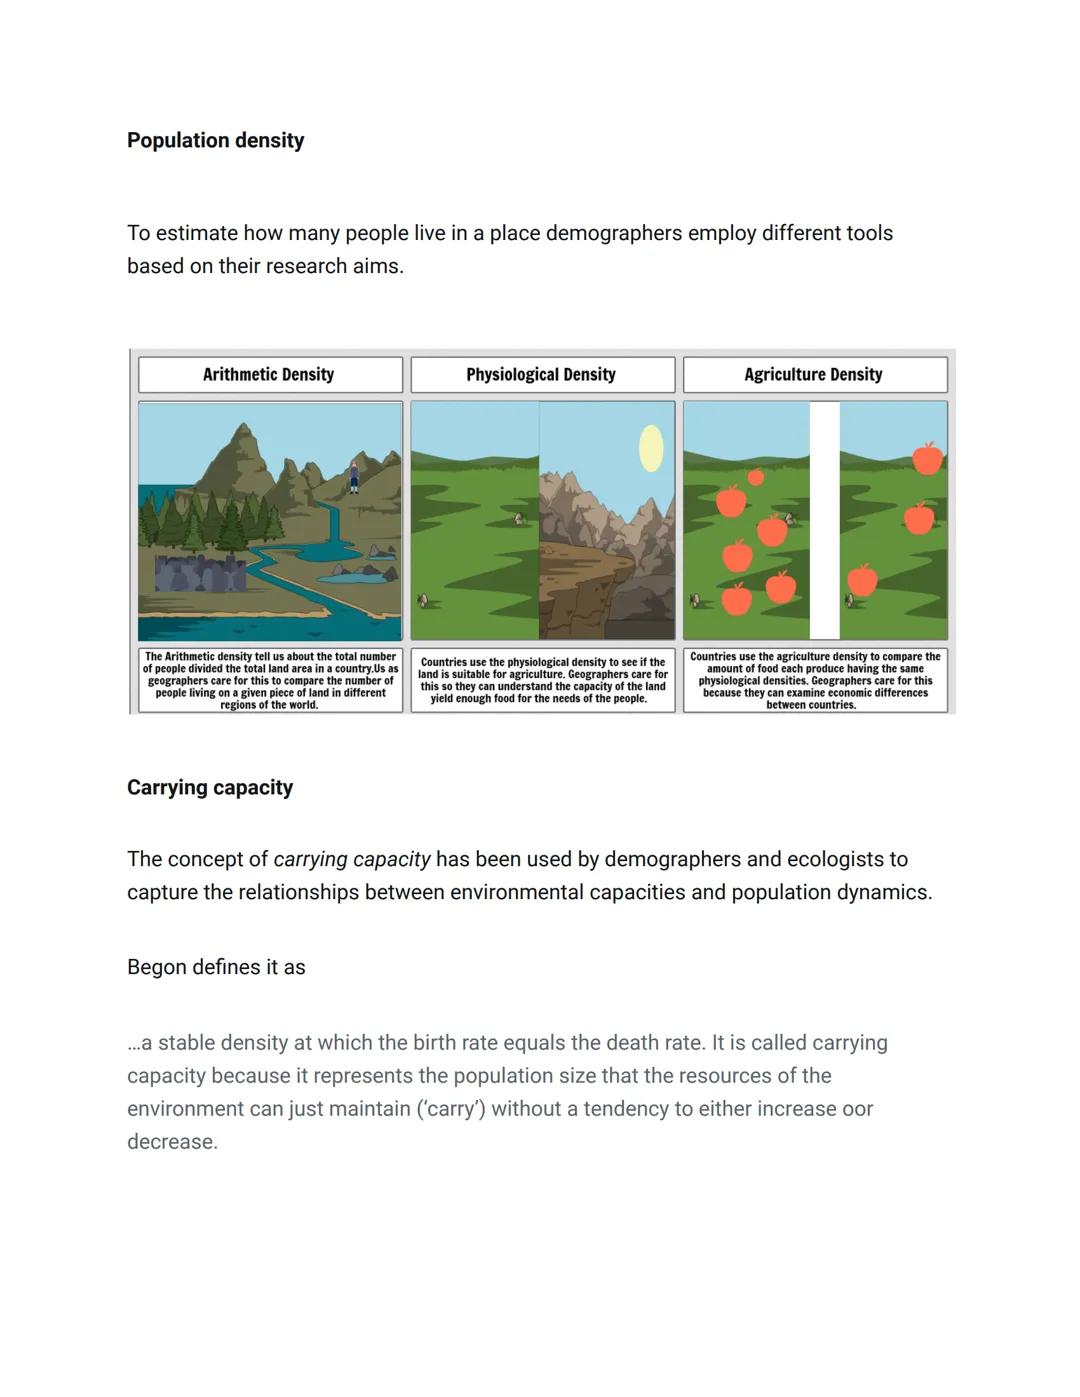
Measuring Population Density
Demographers use several metrics to understand population concentration in different ways. Arithmetic density simply divides the total population by the total land area, giving us a basic comparison between regions. For example, comparing Singapore's density to Canada's reveals dramatically different living patterns.
Physiological density focuses specifically on arable land, showing how many people must be supported by each unit of farmable land. This measure helps assess whether an area's agricultural capacity can meet its population's needs.
Agricultural density examines the relationship between farmers and arable land, which helps identify economic differences between countries with similar physiological densities. A country with fewer farmers per arable acre often indicates greater agricultural efficiency or technology.
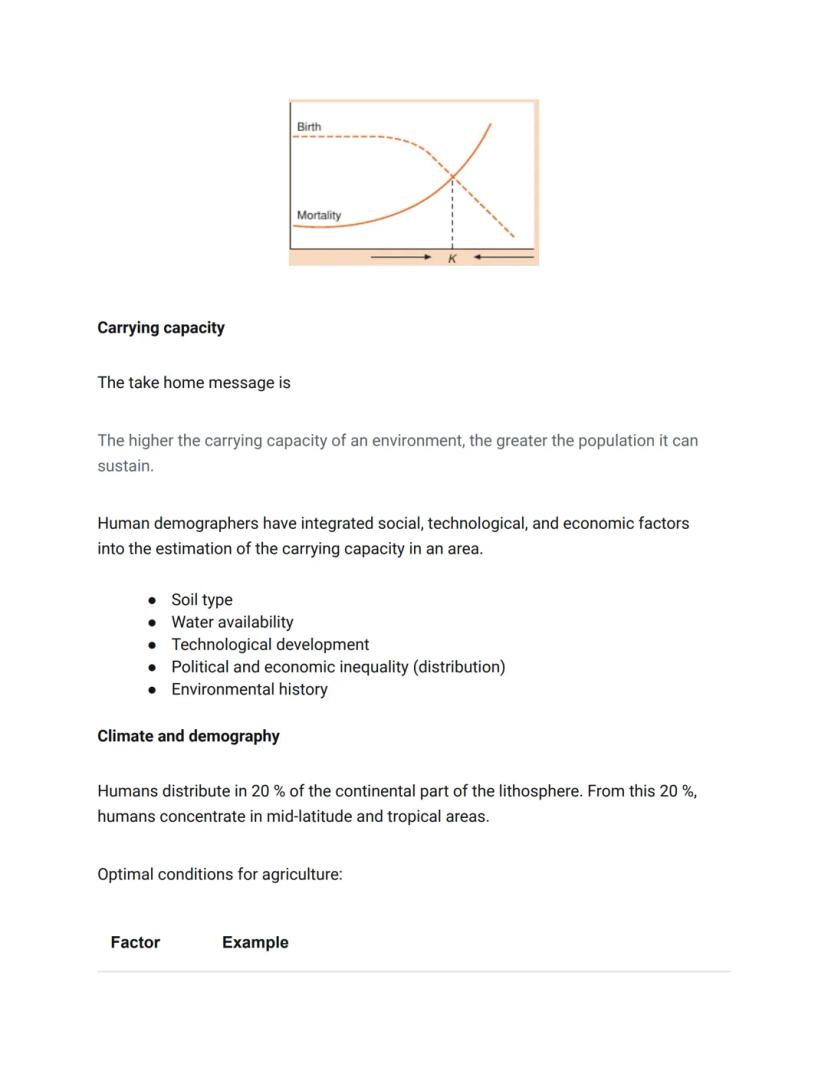
The concept of carrying capacity is crucial in population studies—it represents the maximum population size that an environment can sustain indefinitely. This balance point occurs where birth and death rates equalize, creating population stability. For humans, carrying capacity considers not just natural factors but also technology, economic systems, and resource distribution.
Remember this: Carrying capacity isn't fixed—technological advances, resource management practices, and social systems all influence how many people an area can sustainably support.
3
of 10
Environmental Factors Affecting Human Distribution
The carrying capacity of an environment directly influences how large a population it can support. Unlike with other species, human carrying capacity involves complex factors beyond just natural resources. Our population distribution is shaped by soil types, water availability, technology, political systems, economic inequality, and environmental history.
Climate plays a decisive role in where humans settle. We tend to concentrate in mid-latitude and tropical areas with optimal conditions for agriculture. The most densely populated regions typically feature temperate or tropical climates with reliable rainfall patterns, favorable landforms like valleys and deltas, and nutrient-rich soil types such as mollisols or alfisols.
These environmental advantages create natural centers for human settlement by supporting agricultural productivity. The correlation between fertile agricultural zones and population centers has shaped human geography throughout history, though modern technology has somewhat reduced this dependency.
Think about this: While technology has allowed humans to live in previously uninhabitable places, 80% of Earth's land surface remains sparsely populated. What environmental factors limit settlement in these areas?
4
of 10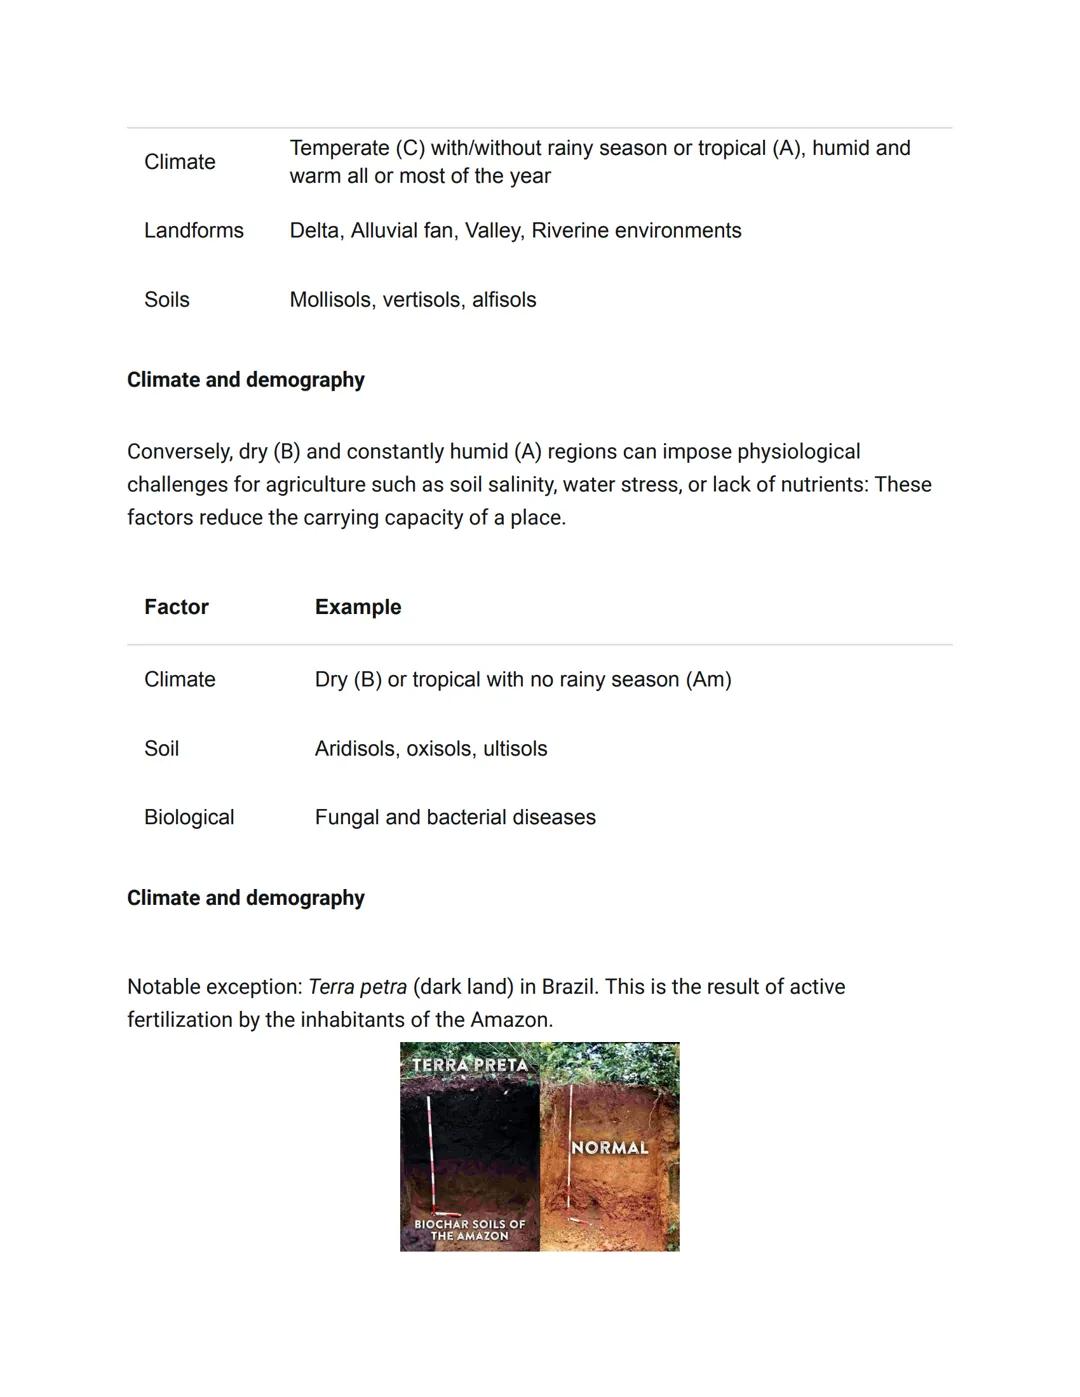
Climate Challenges to Human Settlement
Not all climates support dense human populations equally. Dry regions (classified as "B" climates) and constantly humid areas present significant challenges for agriculture and human settlement. Poor soil types like aridisols (desert soils) or oxisols (highly weathered tropical soils) further limit agricultural potential in these regions.
These environmental limitations historically reduced carrying capacity by making food production more difficult. In arid regions, water scarcity creates natural barriers to dense settlement, while in some tropical regions, nutrient-poor soils and high disease pressure limit agricultural productivity despite abundant rainfall.
Modern technology has partially overcome these limitations through irrigation systems, fertilizers, and disease control. However, these solutions often require significant energy inputs and may not be sustainable long-term.
A fascinating exception to these patterns is found in Brazil's Amazon, where areas of terra preta ("dark earth") support unusually high fertility. These soils were created by ancient indigenous communities who actively enriched the naturally poor tropical soils with charcoal and organic waste, demonstrating how human intervention can transform environmental limitations.
Fascinating fact: Terra preta soils in the Amazon remain fertile centuries after they were created, showing how human communities can permanently increase an environment's carrying capacity through sustainable practices.
5
of 10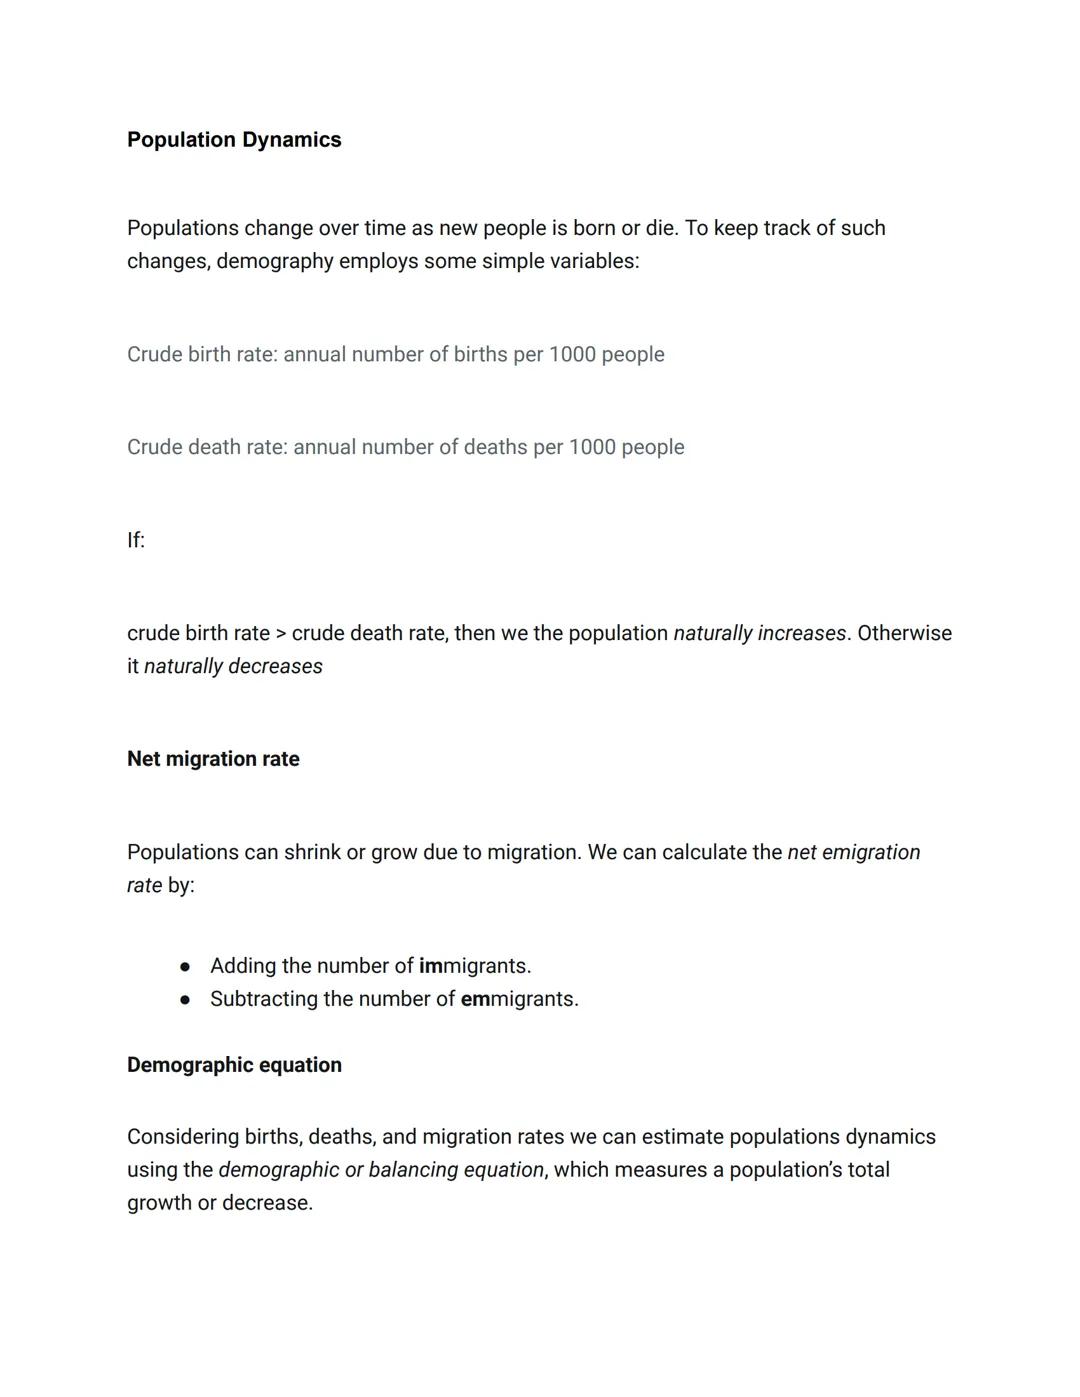
Population Dynamics: The Basic Equations
Population changes follow predictable patterns that demographers track using simple but powerful metrics. The crude birth rate (annual births per 1,000 people) and crude death rate (annual deaths per 1,000 people) form the foundation of population analysis. When birth rates exceed death rates, populations naturally increase; when death rates are higher, they naturally decrease.
Migration adds another dimension to population changes. The net migration rate is calculated by subtracting emigrants (people leaving) from immigrants (people arriving). A positive net migration means more people are moving in than leaving, while a negative rate indicates population loss through migration.
Combining these factors gives us the demographic equation, a powerful tool that calculates total population change:
Final Population = Initial Population + (Births - Deaths) + (Immigrants - Emigrants)
This equation lets us track how populations change over time and project future population sizes. When divided by the total population, we get the growth rate, typically expressed as a percentage, which allows for comparing population dynamics across different-sized communities.
Quick tip: When analyzing population data, remember that natural increase (births minus deaths) and migration patterns often respond to different factors. Economic opportunities might drive migration while cultural factors influence birth rates.
6
of 10
Fertility and Growth Rates
The Total Fertility Rate (TFR) is a crucial demographic indicator that measures the average number of children a woman would have during her reproductive years based on current birth rates. Unlike crude birth rate, TFR isn't affected by a population's age structure, making it ideal for comparing fertility across different societies.
Population sustainability depends on maintaining what demographers call the replacement rate—the fertility level needed for a generation to replace itself. In theory, this would be exactly 2.0 children per woman, but in practice, the replacement rate is about 2.1 to account for mortality before reproductive age.
When calculating population changes, the growth rate formula provides a standardized way to compare population dynamics:
Growth Rate = (Natural Increase ± Net Migration) / Total Population
This percentage tells us how quickly a population is growing or shrinking. A growth rate of 1% means the population will increase by that percentage over the year—which might seem small but compounds significantly over time.
Why it matters: Even small differences in growth rates dramatically affect long-term population trajectories. A country with a 3% annual growth rate will double its population in just 23 years, while one with a 1% rate takes 70 years to double!
7
of 10
Population Projections and Age Structure
Population projections estimate future population size based on current demographic trends. These projections aren't perfectly precise because population changes don't follow simple linear patterns. One complicating factor is population momentum—the tendency for populations to continue growing even after birth rates decline, simply because of the large number of people entering reproductive age.
Demographers use the concept of doubling time to understand growth implications. This calculation reveals how quickly a population will double at its current growth rate. Higher growth rates dramatically shorten doubling time, illustrating why even small rate differences matter enormously over decades.
A population's age structure is visualized using population pyramids, which show the distribution of different age groups (cohorts) by sex. These pyramids reveal valuable information about a society's past and future. Wide bases indicate young populations with high growth potential, while bulging middles or tops reflect aging populations.
The dependency ratio measures the proportion of working-age people (typically 15-64) compared to dependents (children and elderly). This ratio has profound implications for economic planning, as societies with high dependency ratios face greater challenges in providing healthcare, education, and retirement benefits.
Practical application: By examining your country's population pyramid, you can predict future needs for schools, housing, healthcare, and retirement systems decades before they happen!
8
of 10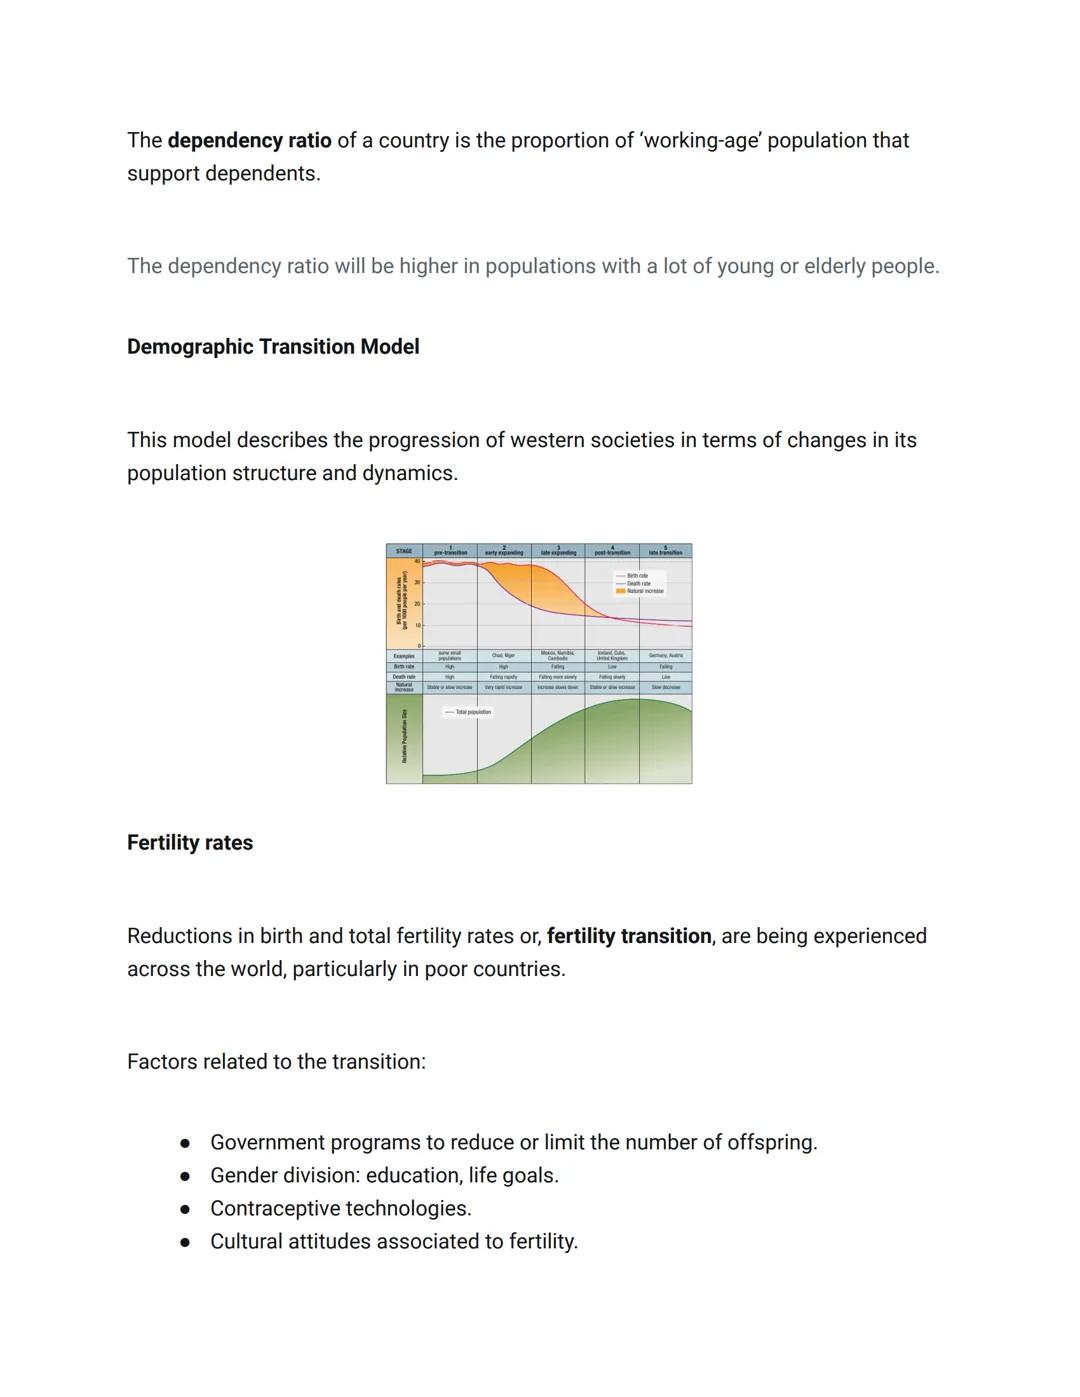
Demographic Transition Model
The Demographic Transition Model describes how populations evolve through predictable stages as societies develop. Originally based on Western historical patterns, this model tracks changes in birth and death rates that accompany economic and social development.
In the first stage, both birth and death rates are high, resulting in slow population growth. As health improves in the second stage, death rates fall while birth rates remain high, creating rapid population growth. The third stage shows declining birth rates catching up to low death rates, slowing growth. In the fourth stage, both rates are low, stabilizing population size.
Fertility transitions—declining birth and total fertility rates—are occurring worldwide, particularly in developing countries. These changes result from multiple factors: government family planning programs, changing gender roles and educational opportunities for women, wider availability of contraceptives, and evolving cultural attitudes about family size.
Economic development typically correlates with lower fertility rates, though the relationship isn't simple. Countries with similar income levels can have dramatically different fertility patterns based on cultural, religious, and policy differences.
Modern perspective: Some demographers now recognize a fifth stage in the demographic transition, where fertility falls below replacement level, leading to population decline in countries like Japan, Italy, and South Korea.
9
of 10
Mortality Patterns and Migration
As countries develop, the causes of death shift dramatically. Infectious diseases decline while chronic conditions like diabetes, heart disease, and cancer become the leading causes of mortality. These "diseases of affluence" often relate to lifestyle factors and typically emerge as life expectancy increases.
Sex ratios (the proportion of males to females) naturally start around 105 males per 100 females at birth but change over time due to various factors. Cultural preferences for male children, gender-based health behaviors, and occupational risks all influence these ratios. Some societies show significantly skewed ratios due to sex-selective practices or different survival rates between genders.
Migration represents another crucial aspect of population dynamics. Demographers categorize migration causes into:
- Push factors: conditions that drive people to leave (like conflict, poverty, or environmental degradation)
- Pull factors: attractions that draw migrants to new locations (such as economic opportunities, political freedom, or family connections)
Migration decisions exist on a spectrum from voluntary to involuntary. Voluntary migrants choose to relocate for better opportunities, while refugees and internally displaced persons move out of necessity due to persecution, conflict, or disasters.
Consider this: Environmental displacement is becoming increasingly common with climate change. Unlike political refugees, "climate refugees" often lack legal recognition in international frameworks despite facing similar life-threatening circumstances.
10
of 10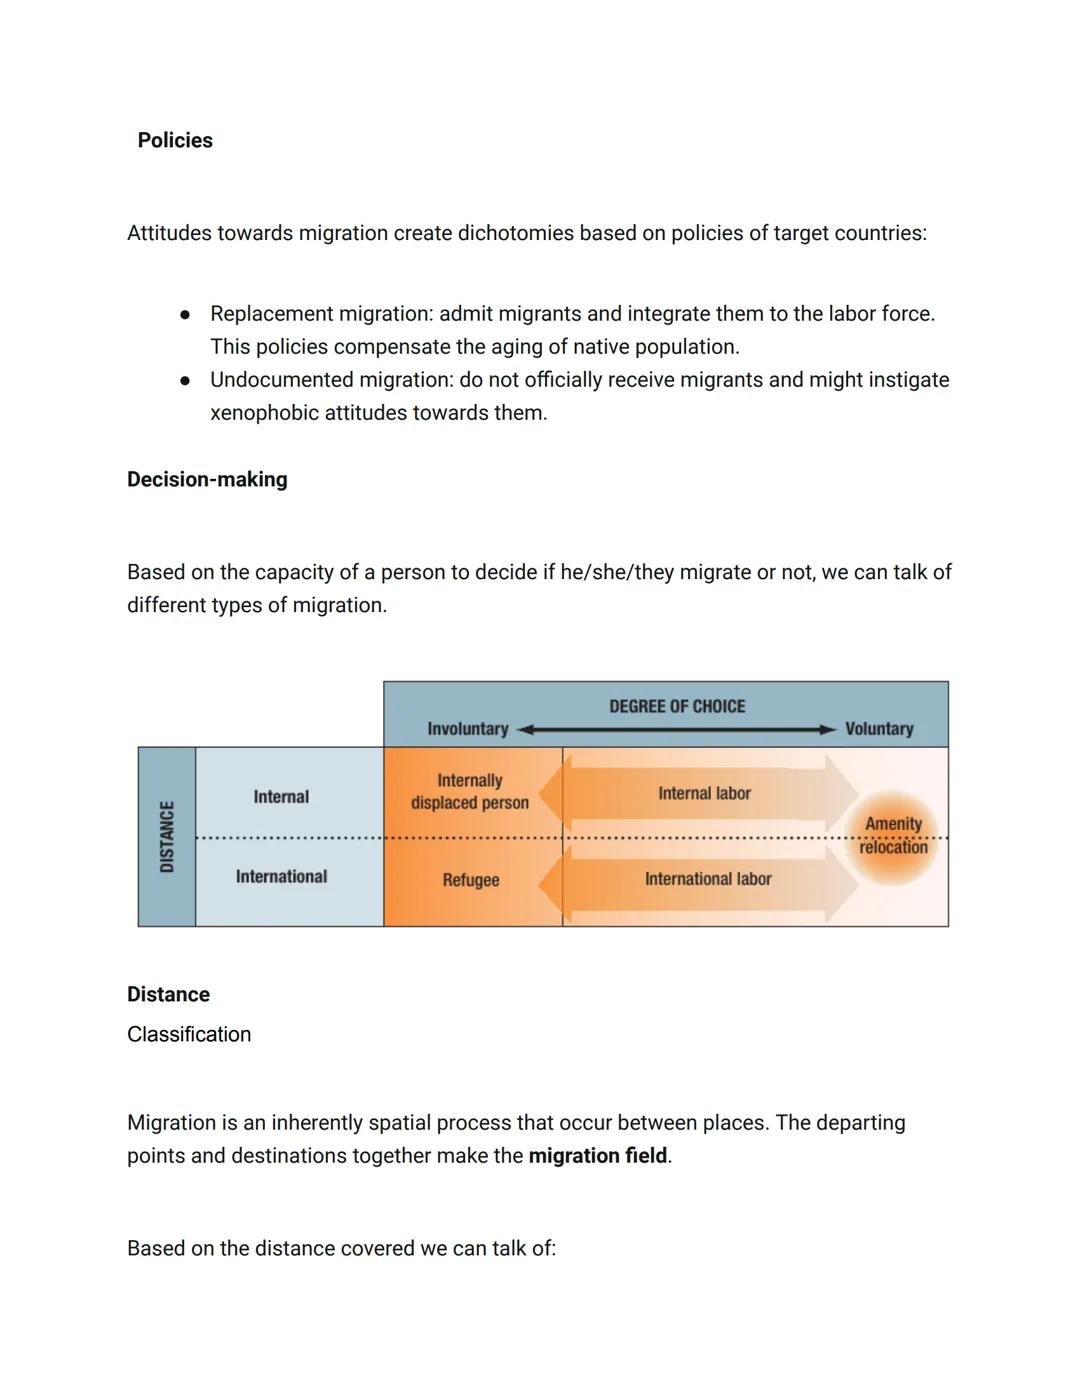
Migration Patterns and Policies
Migration patterns vary based on both distance and degree of choice. Internal migration occurs within national borders, while international migration crosses them. Each type can be further classified based on motivation—labor opportunities, amenity-seeking (like retirement migration), or forced displacement.
The concept of distance decay applies to migration—people are more likely to move shorter distances than longer ones. This creates distinctive patterns where migration intensity decreases with distance from the source area. Migration also tends to follow established pathways, creating what geographers call migration fields between specific origin and destination points.
Countries respond to migration through different policy approaches. Some pursue replacement migration strategies, actively welcoming immigrants to offset aging native populations and fill workforce needs. Others restrict immigration, leading to undocumented migration and sometimes fostering xenophobic attitudes.
Chain migration occurs when immigrants from one community create networks that help others from the same area follow. This process explains why specific immigrant communities often concentrate in particular locations and can persist for generations.
Real-world impact: Migration policies have profound economic consequences. Countries with aging populations often face labor shortages and unsustainable retirement systems without immigration, while sending countries may benefit from remittances but lose talented professionals ("brain drain").
We thought you’d never ask...
Our AI companion is specifically built for the needs of students. Based on the millions of content pieces we have on the platform we can provide truly meaningful and relevant answers to students. But its not only about answers, the companion is even more about guiding students through their daily learning challenges, with personalised study plans, quizzes or content pieces in the chat and 100% personalisation based on the students skills and developments.
You can download the app in the Google Play Store and in the Apple App Store.
That's right! Enjoy free access to study content, connect with fellow students, and get instant help – all at your fingertips.
Similar Content
Most popular content in AP Human Geography
9I
Introduction to Geographic Data
Practice identifying types of geographic data, including qualitative and quantitative sources like census data and satellite imagery.
9th5500
I
Introduction to Human-Environmental Interaction
Practice the foundational concepts of environmental determinism and possibilism and their influence on early geographic thought.
9th4520
I
Introduction to Map Properties and Scale
Practice identifying types of map distortion and calculating map scale to understand how physical reality is represented on a flat surface.
9th2860
P
Population: quiz #1!
Master the fundamentals of population with these easy flashcards designed for high school students. Explore key concepts, terms, and examples to ace your exams!
9th1910
U
Unit 2 Measuring Population Density quiz
Measuring Population Density
9th1720
A
AP HUG UNIT 1
This is a little test to help you practice for AP HUG
10th1890
I
Introduction to Geographic Data Scales
Practice identifying and differentiating between local, regional, national, and global scales of analysis using maps and data sets.
9th1810
A
APHUG Unit 1
10 questions just general info you should know if you have listened in your class :D
9th1580
Full Year APHG (Human Geography) Notes
My full Freshman year’s APHG notes compiled on a document.
9th1,920236
Most popular content
9O
Origins and Dynamics of the Columbian Exchange
Analyze the ecological and economic motivations behind the initial transfer of goods, people, and diseases between the Old and New Worlds.
9th3,1280
I
Introduction to Early Cultural Interactions
Analyze the initial social and religious encounters between Europeans, Africans, and Indigenous peoples in the colonial Americas.
9th2,7730
O
Origins of Ancient River Civilizations
Analyze the environmental factors and technological innovations that led to the rise of early states in Mesopotamia, Egypt, and the Indus Valley.
9th3,1870
M
Motivations for European Exploration
Analyze the economic, religious, and political factors that drove European powers to the Americas during the 15th and 16th centuries.
9th1,7780
F
Foundations of Ethical Guidelines in Research
Practice the core principles of the APA ethical code including informed consent, debriefing, and the role of Institutional Review Boards.
9th1,3360
I
Introduction to Native American Societies
Examine the diverse social, political, and economic structures of North American indigenous groups prior to European contact.
9th1,1100
I
Introduction to the Spanish Encomienda System
Explore the fundamental economic and social structures of the Spanish colonial system, focusing on the encomienda and the casta social hierarchy.
9th8890
I
Introduction to Biological Elements of Life
Practice identifying the essential elements including carbon, nitrogen, phosphorus, and sulfur that compose biological macromolecules.
9th1,7410
O
Origins of the Articles of Confederation
Practice identifying the motivations for a weak central government and the specific powers granted to the states under the first U.S. constitution.
9th9370
Students love us — and so will you.
4.6/5App Store
4.7/5Google Play
The app is very easy to use and well designed. I have found everything I was looking for so far and have been able to learn a lot from the presentations! I will definitely use the app for a class assignment! And of course it also helps a lot as an inspiration.
Stefan SiOS user
This app is really great. There are so many study notes and help [...]. My problem subject is French, for example, and the app has so many options for help. Thanks to this app, I have improved my French. I would recommend it to anyone.
Samantha KlichAndroid user
Wow, I am really amazed. I just tried the app because I've seen it advertised many times and was absolutely stunned. This app is THE HELP you want for school and above all, it offers so many things, such as workouts and fact sheets, which have been VERY helpful to me personally.
AnnaiOS user
Week 5: Exploring Demography Concepts
Y
Yessica Ramirez@essicaamirez_sjkhsjq
Population geography explores how humans are distributed across our planet and what factors influence these patterns. Demographers study population characteristics such as size, structure, and movement to understand human communities. With the global population recently reaching 8 billion people, understanding...
1
of 10
Sign up to see the content. It's free!
- Access to all documents
- Improve your grades
- Join milions of students
Population Geography Fundamentals
Population geography examines where people live and why certain areas become densely populated while others remain sparsely inhabited. Demographers analyze population using two main tools: census data (complete population counts) and estimations (calculated projections for areas where complete counts aren't feasible).
Despite Earth's vast landmass, humans aren't evenly distributed across it. Remarkably, about 90% of the world's population occupies just 20% of the available land surface. This concentration reflects both natural environmental factors and human historical patterns.
The United Nations estimates our global population reached 8 billion in November 2022 and projects growth to 10.4 billion by the 2080s. Understanding these numbers helps governments and planners make informed decisions about resources, infrastructure, and services.
Did you know? Census data isn't just for counting people—it collects crucial socioeconomic information that governments use for everything from building schools to planning healthcare systems.
2
of 10Sign up to see the content. It's free!
- Access to all documents
- Improve your grades
- Join milions of students
Measuring Population Density
Demographers use several metrics to understand population concentration in different ways. Arithmetic density simply divides the total population by the total land area, giving us a basic comparison between regions. For example, comparing Singapore's density to Canada's reveals dramatically different living patterns.
Physiological density focuses specifically on arable land, showing how many people must be supported by each unit of farmable land. This measure helps assess whether an area's agricultural capacity can meet its population's needs.
Agricultural density examines the relationship between farmers and arable land, which helps identify economic differences between countries with similar physiological densities. A country with fewer farmers per arable acre often indicates greater agricultural efficiency or technology.
The concept of carrying capacity is crucial in population studies—it represents the maximum population size that an environment can sustain indefinitely. This balance point occurs where birth and death rates equalize, creating population stability. For humans, carrying capacity considers not just natural factors but also technology, economic systems, and resource distribution.
Remember this: Carrying capacity isn't fixed—technological advances, resource management practices, and social systems all influence how many people an area can sustainably support.
3
of 10Sign up to see the content. It's free!
- Access to all documents
- Improve your grades
- Join milions of students
Environmental Factors Affecting Human Distribution
The carrying capacity of an environment directly influences how large a population it can support. Unlike with other species, human carrying capacity involves complex factors beyond just natural resources. Our population distribution is shaped by soil types, water availability, technology, political systems, economic inequality, and environmental history.
Climate plays a decisive role in where humans settle. We tend to concentrate in mid-latitude and tropical areas with optimal conditions for agriculture. The most densely populated regions typically feature temperate or tropical climates with reliable rainfall patterns, favorable landforms like valleys and deltas, and nutrient-rich soil types such as mollisols or alfisols.
These environmental advantages create natural centers for human settlement by supporting agricultural productivity. The correlation between fertile agricultural zones and population centers has shaped human geography throughout history, though modern technology has somewhat reduced this dependency.
Think about this: While technology has allowed humans to live in previously uninhabitable places, 80% of Earth's land surface remains sparsely populated. What environmental factors limit settlement in these areas?
4
of 10Sign up to see the content. It's free!
- Access to all documents
- Improve your grades
- Join milions of students
Climate Challenges to Human Settlement
Not all climates support dense human populations equally. Dry regions (classified as "B" climates) and constantly humid areas present significant challenges for agriculture and human settlement. Poor soil types like aridisols (desert soils) or oxisols (highly weathered tropical soils) further limit agricultural potential in these regions.
These environmental limitations historically reduced carrying capacity by making food production more difficult. In arid regions, water scarcity creates natural barriers to dense settlement, while in some tropical regions, nutrient-poor soils and high disease pressure limit agricultural productivity despite abundant rainfall.
Modern technology has partially overcome these limitations through irrigation systems, fertilizers, and disease control. However, these solutions often require significant energy inputs and may not be sustainable long-term.
A fascinating exception to these patterns is found in Brazil's Amazon, where areas of terra preta ("dark earth") support unusually high fertility. These soils were created by ancient indigenous communities who actively enriched the naturally poor tropical soils with charcoal and organic waste, demonstrating how human intervention can transform environmental limitations.
Fascinating fact: Terra preta soils in the Amazon remain fertile centuries after they were created, showing how human communities can permanently increase an environment's carrying capacity through sustainable practices.
5
of 10Sign up to see the content. It's free!
- Access to all documents
- Improve your grades
- Join milions of students
Population Dynamics: The Basic Equations
Population changes follow predictable patterns that demographers track using simple but powerful metrics. The crude birth rate (annual births per 1,000 people) and crude death rate (annual deaths per 1,000 people) form the foundation of population analysis. When birth rates exceed death rates, populations naturally increase; when death rates are higher, they naturally decrease.
Migration adds another dimension to population changes. The net migration rate is calculated by subtracting emigrants (people leaving) from immigrants (people arriving). A positive net migration means more people are moving in than leaving, while a negative rate indicates population loss through migration.
Combining these factors gives us the demographic equation, a powerful tool that calculates total population change:
Final Population = Initial Population + (Births - Deaths) + (Immigrants - Emigrants)
This equation lets us track how populations change over time and project future population sizes. When divided by the total population, we get the growth rate, typically expressed as a percentage, which allows for comparing population dynamics across different-sized communities.
Quick tip: When analyzing population data, remember that natural increase (births minus deaths) and migration patterns often respond to different factors. Economic opportunities might drive migration while cultural factors influence birth rates.
6
of 10Sign up to see the content. It's free!
- Access to all documents
- Improve your grades
- Join milions of students
Fertility and Growth Rates
The Total Fertility Rate (TFR) is a crucial demographic indicator that measures the average number of children a woman would have during her reproductive years based on current birth rates. Unlike crude birth rate, TFR isn't affected by a population's age structure, making it ideal for comparing fertility across different societies.
Population sustainability depends on maintaining what demographers call the replacement rate—the fertility level needed for a generation to replace itself. In theory, this would be exactly 2.0 children per woman, but in practice, the replacement rate is about 2.1 to account for mortality before reproductive age.
When calculating population changes, the growth rate formula provides a standardized way to compare population dynamics:
Growth Rate = (Natural Increase ± Net Migration) / Total Population
This percentage tells us how quickly a population is growing or shrinking. A growth rate of 1% means the population will increase by that percentage over the year—which might seem small but compounds significantly over time.
Why it matters: Even small differences in growth rates dramatically affect long-term population trajectories. A country with a 3% annual growth rate will double its population in just 23 years, while one with a 1% rate takes 70 years to double!
7
of 10Sign up to see the content. It's free!
- Access to all documents
- Improve your grades
- Join milions of students
Population Projections and Age Structure
Population projections estimate future population size based on current demographic trends. These projections aren't perfectly precise because population changes don't follow simple linear patterns. One complicating factor is population momentum—the tendency for populations to continue growing even after birth rates decline, simply because of the large number of people entering reproductive age.
Demographers use the concept of doubling time to understand growth implications. This calculation reveals how quickly a population will double at its current growth rate. Higher growth rates dramatically shorten doubling time, illustrating why even small rate differences matter enormously over decades.
A population's age structure is visualized using population pyramids, which show the distribution of different age groups (cohorts) by sex. These pyramids reveal valuable information about a society's past and future. Wide bases indicate young populations with high growth potential, while bulging middles or tops reflect aging populations.
The dependency ratio measures the proportion of working-age people (typically 15-64) compared to dependents (children and elderly). This ratio has profound implications for economic planning, as societies with high dependency ratios face greater challenges in providing healthcare, education, and retirement benefits.
Practical application: By examining your country's population pyramid, you can predict future needs for schools, housing, healthcare, and retirement systems decades before they happen!
8
of 10Sign up to see the content. It's free!
- Access to all documents
- Improve your grades
- Join milions of students
Demographic Transition Model
The Demographic Transition Model describes how populations evolve through predictable stages as societies develop. Originally based on Western historical patterns, this model tracks changes in birth and death rates that accompany economic and social development.
In the first stage, both birth and death rates are high, resulting in slow population growth. As health improves in the second stage, death rates fall while birth rates remain high, creating rapid population growth. The third stage shows declining birth rates catching up to low death rates, slowing growth. In the fourth stage, both rates are low, stabilizing population size.
Fertility transitions—declining birth and total fertility rates—are occurring worldwide, particularly in developing countries. These changes result from multiple factors: government family planning programs, changing gender roles and educational opportunities for women, wider availability of contraceptives, and evolving cultural attitudes about family size.
Economic development typically correlates with lower fertility rates, though the relationship isn't simple. Countries with similar income levels can have dramatically different fertility patterns based on cultural, religious, and policy differences.
Modern perspective: Some demographers now recognize a fifth stage in the demographic transition, where fertility falls below replacement level, leading to population decline in countries like Japan, Italy, and South Korea.
9
of 10Sign up to see the content. It's free!
- Access to all documents
- Improve your grades
- Join milions of students
Mortality Patterns and Migration
As countries develop, the causes of death shift dramatically. Infectious diseases decline while chronic conditions like diabetes, heart disease, and cancer become the leading causes of mortality. These "diseases of affluence" often relate to lifestyle factors and typically emerge as life expectancy increases.
Sex ratios (the proportion of males to females) naturally start around 105 males per 100 females at birth but change over time due to various factors. Cultural preferences for male children, gender-based health behaviors, and occupational risks all influence these ratios. Some societies show significantly skewed ratios due to sex-selective practices or different survival rates between genders.
Migration represents another crucial aspect of population dynamics. Demographers categorize migration causes into:
- Push factors: conditions that drive people to leave (like conflict, poverty, or environmental degradation)
- Pull factors: attractions that draw migrants to new locations (such as economic opportunities, political freedom, or family connections)
Migration decisions exist on a spectrum from voluntary to involuntary. Voluntary migrants choose to relocate for better opportunities, while refugees and internally displaced persons move out of necessity due to persecution, conflict, or disasters.
Consider this: Environmental displacement is becoming increasingly common with climate change. Unlike political refugees, "climate refugees" often lack legal recognition in international frameworks despite facing similar life-threatening circumstances.
10
of 10Sign up to see the content. It's free!
- Access to all documents
- Improve your grades
- Join milions of students
Migration Patterns and Policies
Migration patterns vary based on both distance and degree of choice. Internal migration occurs within national borders, while international migration crosses them. Each type can be further classified based on motivation—labor opportunities, amenity-seeking (like retirement migration), or forced displacement.
The concept of distance decay applies to migration—people are more likely to move shorter distances than longer ones. This creates distinctive patterns where migration intensity decreases with distance from the source area. Migration also tends to follow established pathways, creating what geographers call migration fields between specific origin and destination points.
Countries respond to migration through different policy approaches. Some pursue replacement migration strategies, actively welcoming immigrants to offset aging native populations and fill workforce needs. Others restrict immigration, leading to undocumented migration and sometimes fostering xenophobic attitudes.
Chain migration occurs when immigrants from one community create networks that help others from the same area follow. This process explains why specific immigrant communities often concentrate in particular locations and can persist for generations.
Real-world impact: Migration policies have profound economic consequences. Countries with aging populations often face labor shortages and unsustainable retirement systems without immigration, while sending countries may benefit from remittances but lose talented professionals ("brain drain").
We thought you’d never ask...
Our AI companion is specifically built for the needs of students. Based on the millions of content pieces we have on the platform we can provide truly meaningful and relevant answers to students. But its not only about answers, the companion is even more about guiding students through their daily learning challenges, with personalised study plans, quizzes or content pieces in the chat and 100% personalisation based on the students skills and developments.
You can download the app in the Google Play Store and in the Apple App Store.
That's right! Enjoy free access to study content, connect with fellow students, and get instant help – all at your fingertips.
Similar Content
Most popular content in AP Human Geography
9I
Introduction to Geographic Data
Practice identifying types of geographic data, including qualitative and quantitative sources like census data and satellite imagery.
9th5500
I
Introduction to Human-Environmental Interaction
Practice the foundational concepts of environmental determinism and possibilism and their influence on early geographic thought.
9th4520
I
Introduction to Map Properties and Scale
Practice identifying types of map distortion and calculating map scale to understand how physical reality is represented on a flat surface.
9th2860
P
Population: quiz #1!
Master the fundamentals of population with these easy flashcards designed for high school students. Explore key concepts, terms, and examples to ace your exams!
9th1910
U
Unit 2 Measuring Population Density quiz
Measuring Population Density
9th1720
A
AP HUG UNIT 1
This is a little test to help you practice for AP HUG
10th1890
I
Introduction to Geographic Data Scales
Practice identifying and differentiating between local, regional, national, and global scales of analysis using maps and data sets.
9th1810
A
APHUG Unit 1
10 questions just general info you should know if you have listened in your class :D
9th1580
Full Year APHG (Human Geography) Notes
My full Freshman year’s APHG notes compiled on a document.
9th1,920236
Most popular content
9O
Origins and Dynamics of the Columbian Exchange
Analyze the ecological and economic motivations behind the initial transfer of goods, people, and diseases between the Old and New Worlds.
9th3,1280
I
Introduction to Early Cultural Interactions
Analyze the initial social and religious encounters between Europeans, Africans, and Indigenous peoples in the colonial Americas.
9th2,7730
O
Origins of Ancient River Civilizations
Analyze the environmental factors and technological innovations that led to the rise of early states in Mesopotamia, Egypt, and the Indus Valley.
9th3,1870
M
Motivations for European Exploration
Analyze the economic, religious, and political factors that drove European powers to the Americas during the 15th and 16th centuries.
9th1,7780
F
Foundations of Ethical Guidelines in Research
Practice the core principles of the APA ethical code including informed consent, debriefing, and the role of Institutional Review Boards.
9th1,3360
I
Introduction to Native American Societies
Examine the diverse social, political, and economic structures of North American indigenous groups prior to European contact.
9th1,1100
I
Introduction to the Spanish Encomienda System
Explore the fundamental economic and social structures of the Spanish colonial system, focusing on the encomienda and the casta social hierarchy.
9th8890
I
Introduction to Biological Elements of Life
Practice identifying the essential elements including carbon, nitrogen, phosphorus, and sulfur that compose biological macromolecules.
9th1,7410
O
Origins of the Articles of Confederation
Practice identifying the motivations for a weak central government and the specific powers granted to the states under the first U.S. constitution.
9th9370
Students love us — and so will you.
4.6/5App Store
4.7/5Google Play
The app is very easy to use and well designed. I have found everything I was looking for so far and have been able to learn a lot from the presentations! I will definitely use the app for a class assignment! And of course it also helps a lot as an inspiration.
Stefan SiOS user
This app is really great. There are so many study notes and help [...]. My problem subject is French, for example, and the app has so many options for help. Thanks to this app, I have improved my French. I would recommend it to anyone.
Samantha KlichAndroid user
Wow, I am really amazed. I just tried the app because I've seen it advertised many times and was absolutely stunned. This app is THE HELP you want for school and above all, it offers so many things, such as workouts and fact sheets, which have been VERY helpful to me personally.
AnnaiOS user