Get ready to dive into AP Precalculus as we explore...
AP Precalculus Unit 1.1 Notes
Deekshitha Kasturi@deekshithakasturi_
1
of 2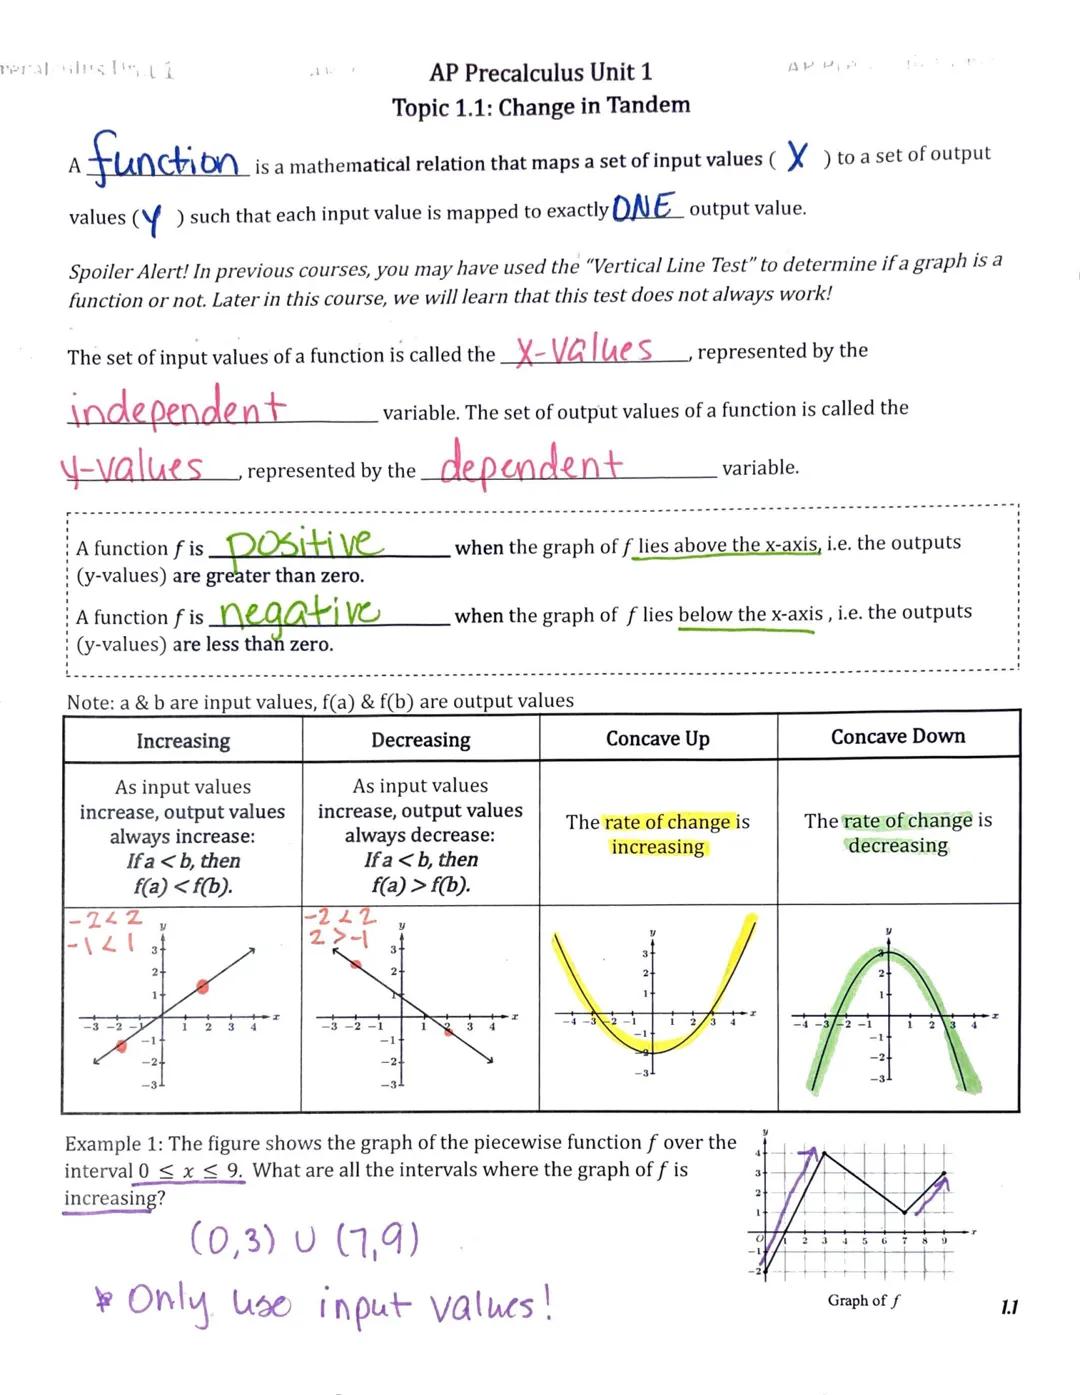
Change in Tandem: Understanding Functions
A function maps input values to output values with one critical rule: each input value must correspond to exactly one output. Think of it as a machine where you put in an x-value and get exactly one y-value out.
Functions have two key components: the independent variable (x-values or inputs) and the dependent variable (y-values or outputs). When analyzing functions graphically, remember that a function is positive when its graph is above the x-axis and negative when below.
Understanding how functions change is crucial. A function is increasing when output values rise as input values increase. Conversely, it's decreasing when output values fall as input values increase. Additionally, functions can be concave up (rate of change increasing) or concave down (rate of change decreasing).
Pro Tip: When identifying intervals where a function is increasing or decreasing, always express your answer using the input values (x-values), not the outputs!
For example, if a piecewise function is shown on the interval [0,9], and we need to find where it's increasing, we'd look for sections where the graph rises from left to right—in this case (0,3) and (7,9).
2
of 2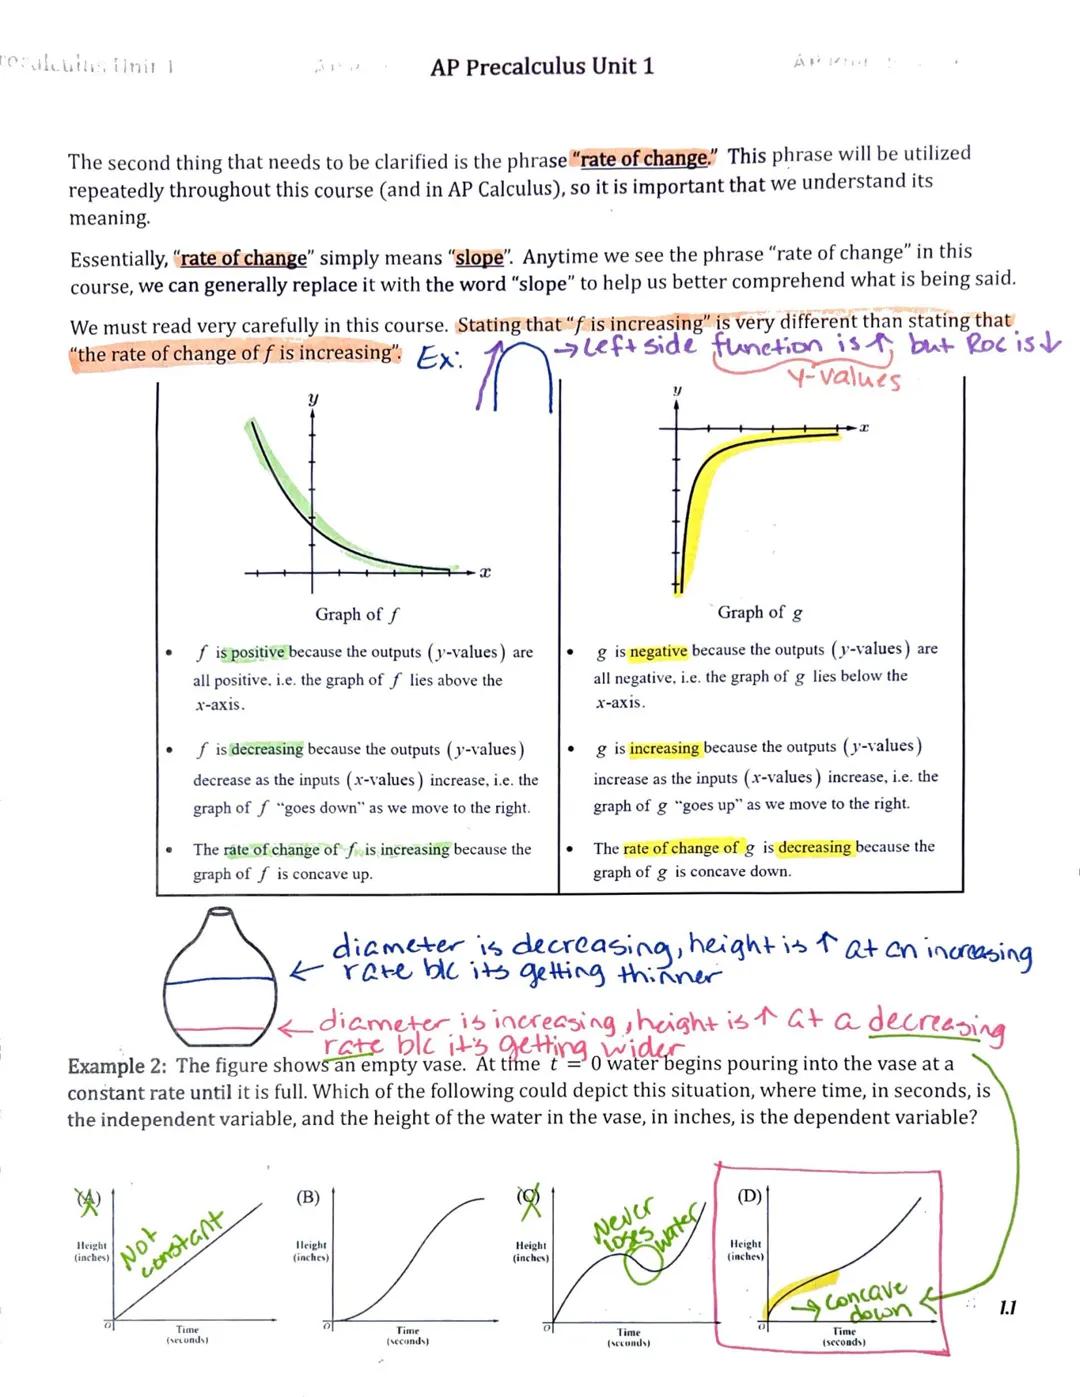
We thought you’d never ask...
Our AI companion is specifically built for the needs of students. Based on the millions of content pieces we have on the platform we can provide truly meaningful and relevant answers to students. But its not only about answers, the companion is even more about guiding students through their daily learning challenges, with personalised study plans, quizzes or content pieces in the chat and 100% personalisation based on the students skills and developments.
You can download the app in the Google Play Store and in the Apple App Store.
That's right! Enjoy free access to study content, connect with fellow students, and get instant help – all at your fingertips.
Similar Content
Most popular content
9O
Origins and Dynamics of the Columbian Exchange
Analyze the ecological and economic motivations behind the initial transfer of goods, people, and diseases between the Old and New Worlds.
9th3,1280
I
Introduction to Early Cultural Interactions
Analyze the initial social and religious encounters between Europeans, Africans, and Indigenous peoples in the colonial Americas.
9th2,7730
O
Origins of Ancient River Civilizations
Analyze the environmental factors and technological innovations that led to the rise of early states in Mesopotamia, Egypt, and the Indus Valley.
9th3,1870
M
Motivations for European Exploration
Analyze the economic, religious, and political factors that drove European powers to the Americas during the 15th and 16th centuries.
9th1,7780
F
Foundations of Ethical Guidelines in Research
Practice the core principles of the APA ethical code including informed consent, debriefing, and the role of Institutional Review Boards.
9th1,3360
I
Introduction to Native American Societies
Examine the diverse social, political, and economic structures of North American indigenous groups prior to European contact.
9th1,1100
I
Introduction to the Spanish Encomienda System
Explore the fundamental economic and social structures of the Spanish colonial system, focusing on the encomienda and the casta social hierarchy.
9th8890
I
Introduction to Biological Elements of Life
Practice identifying the essential elements including carbon, nitrogen, phosphorus, and sulfur that compose biological macromolecules.
9th1,7410
O
Origins of the Articles of Confederation
Practice identifying the motivations for a weak central government and the specific powers granted to the states under the first U.S. constitution.
9th9370
Students love us — and so will you.
4.6/5App Store
4.7/5Google Play
The app is very easy to use and well designed. I have found everything I was looking for so far and have been able to learn a lot from the presentations! I will definitely use the app for a class assignment! And of course it also helps a lot as an inspiration.
Stefan SiOS user
This app is really great. There are so many study notes and help [...]. My problem subject is French, for example, and the app has so many options for help. Thanks to this app, I have improved my French. I would recommend it to anyone.
Samantha KlichAndroid user
Wow, I am really amazed. I just tried the app because I've seen it advertised many times and was absolutely stunned. This app is THE HELP you want for school and above all, it offers so many things, such as workouts and fact sheets, which have been VERY helpful to me personally.
AnnaiOS user
AP Precalculus Unit 1.1 Notes
Deekshitha Kasturi@deekshithakasturi_
Get ready to dive into AP Precalculus as we explore how quantities change together! This foundational unit helps you understand functions—mathematical relationships that form the backbone of calculus and real-world applications.
1
of 2
Sign up to see the content. It's free!
- Access to all documents
- Improve your grades
- Join milions of students
Change in Tandem: Understanding Functions
A function maps input values to output values with one critical rule: each input value must correspond to exactly one output. Think of it as a machine where you put in an x-value and get exactly one y-value out.
Functions have two key components: the independent variable (x-values or inputs) and the dependent variable (y-values or outputs). When analyzing functions graphically, remember that a function is positive when its graph is above the x-axis and negative when below.
Understanding how functions change is crucial. A function is increasing when output values rise as input values increase. Conversely, it's decreasing when output values fall as input values increase. Additionally, functions can be concave up (rate of change increasing) or concave down (rate of change decreasing).
Pro Tip: When identifying intervals where a function is increasing or decreasing, always express your answer using the input values (x-values), not the outputs!
For example, if a piecewise function is shown on the interval [0,9], and we need to find where it's increasing, we'd look for sections where the graph rises from left to right—in this case (0,3) and (7,9).
2
of 2Sign up to see the content. It's free!
- Access to all documents
- Improve your grades
- Join milions of students
We thought you’d never ask...
Our AI companion is specifically built for the needs of students. Based on the millions of content pieces we have on the platform we can provide truly meaningful and relevant answers to students. But its not only about answers, the companion is even more about guiding students through their daily learning challenges, with personalised study plans, quizzes or content pieces in the chat and 100% personalisation based on the students skills and developments.
You can download the app in the Google Play Store and in the Apple App Store.
That's right! Enjoy free access to study content, connect with fellow students, and get instant help – all at your fingertips.
Similar Content
Most popular content
9O
Origins and Dynamics of the Columbian Exchange
Analyze the ecological and economic motivations behind the initial transfer of goods, people, and diseases between the Old and New Worlds.
9th3,1280
I
Introduction to Early Cultural Interactions
Analyze the initial social and religious encounters between Europeans, Africans, and Indigenous peoples in the colonial Americas.
9th2,7730
O
Origins of Ancient River Civilizations
Analyze the environmental factors and technological innovations that led to the rise of early states in Mesopotamia, Egypt, and the Indus Valley.
9th3,1870
M
Motivations for European Exploration
Analyze the economic, religious, and political factors that drove European powers to the Americas during the 15th and 16th centuries.
9th1,7780
F
Foundations of Ethical Guidelines in Research
Practice the core principles of the APA ethical code including informed consent, debriefing, and the role of Institutional Review Boards.
9th1,3360
I
Introduction to Native American Societies
Examine the diverse social, political, and economic structures of North American indigenous groups prior to European contact.
9th1,1100
I
Introduction to the Spanish Encomienda System
Explore the fundamental economic and social structures of the Spanish colonial system, focusing on the encomienda and the casta social hierarchy.
9th8890
I
Introduction to Biological Elements of Life
Practice identifying the essential elements including carbon, nitrogen, phosphorus, and sulfur that compose biological macromolecules.
9th1,7410
O
Origins of the Articles of Confederation
Practice identifying the motivations for a weak central government and the specific powers granted to the states under the first U.S. constitution.
9th9370
Students love us — and so will you.
4.6/5App Store
4.7/5Google Play
The app is very easy to use and well designed. I have found everything I was looking for so far and have been able to learn a lot from the presentations! I will definitely use the app for a class assignment! And of course it also helps a lot as an inspiration.
Stefan SiOS user
This app is really great. There are so many study notes and help [...]. My problem subject is French, for example, and the app has so many options for help. Thanks to this app, I have improved my French. I would recommend it to anyone.
Samantha KlichAndroid user
Wow, I am really amazed. I just tried the app because I've seen it advertised many times and was absolutely stunned. This app is THE HELP you want for school and above all, it offers so many things, such as workouts and fact sheets, which have been VERY helpful to me personally.
AnnaiOS user