Ready to dive into the world of data relationships? Let's...
Understanding Scatterplots and Correlation Made Easy


1 / 8
1
of 8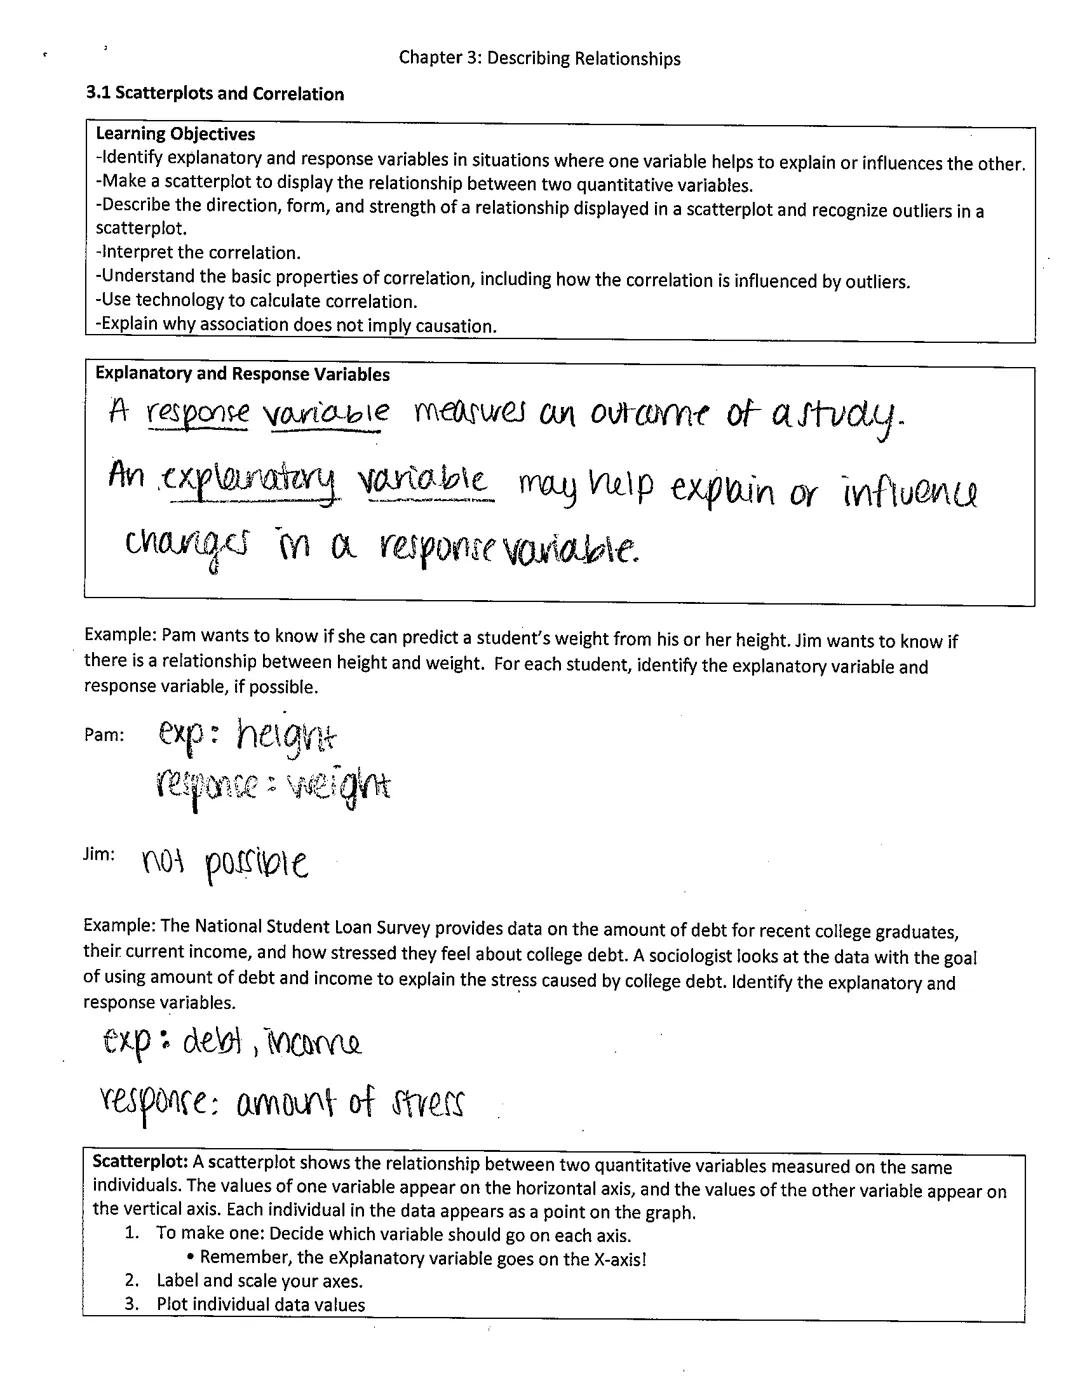
Explanatory and Response Variables
When looking at relationships between variables, it helps to know which one might be influencing the other. An explanatory variable potentially explains or influences changes in another variable, while a response variable measures the outcome we're interested in.
For example, if Pam wants to predict a student's weight based on height, height is the explanatory variable and weight is the response variable. But if Jim just wants to know if there's a relationship between height and weight without predicting one from the other, we can't designate explanatory and response variables.
Creating a scatterplot is the first step in visualizing relationships between two quantitative variables. To make one:
- Put the explanatory variable on the x-axis
- Label and scale both axes appropriately
- Plot each data point as a single dot on the graph
💡 Always remember this rule: the explanatory variable goes on the x-axis and the response variable goes on the y-axis!
2
of 8
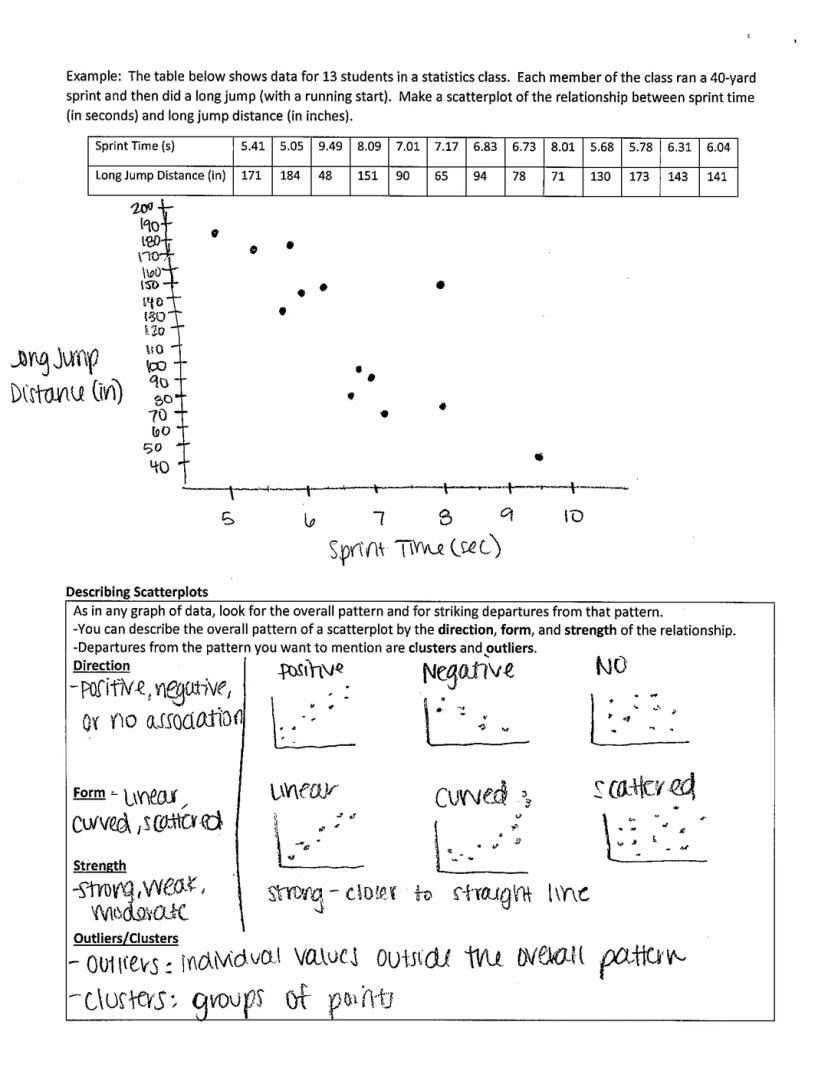
Describing Scatterplots
Once you've created a scatterplot, you need to analyze what it shows. Look for overall patterns and any unusual points that stand out. Describe the relationship by examining three key characteristics:
Direction: Is the relationship positive (points trend upward), negative (points trend downward), or is there no clear direction?
Form: Do the points roughly follow a straight line (linear), a curve, or are they scattered randomly?
Strength: How closely do the points follow the pattern? Strong relationships have points clustered tightly around a pattern, while weak ones have more scattered points.
You should also look for any outliers (individual points that fall outside the overall pattern) and clusters (groups of points that seem to form their own pattern).
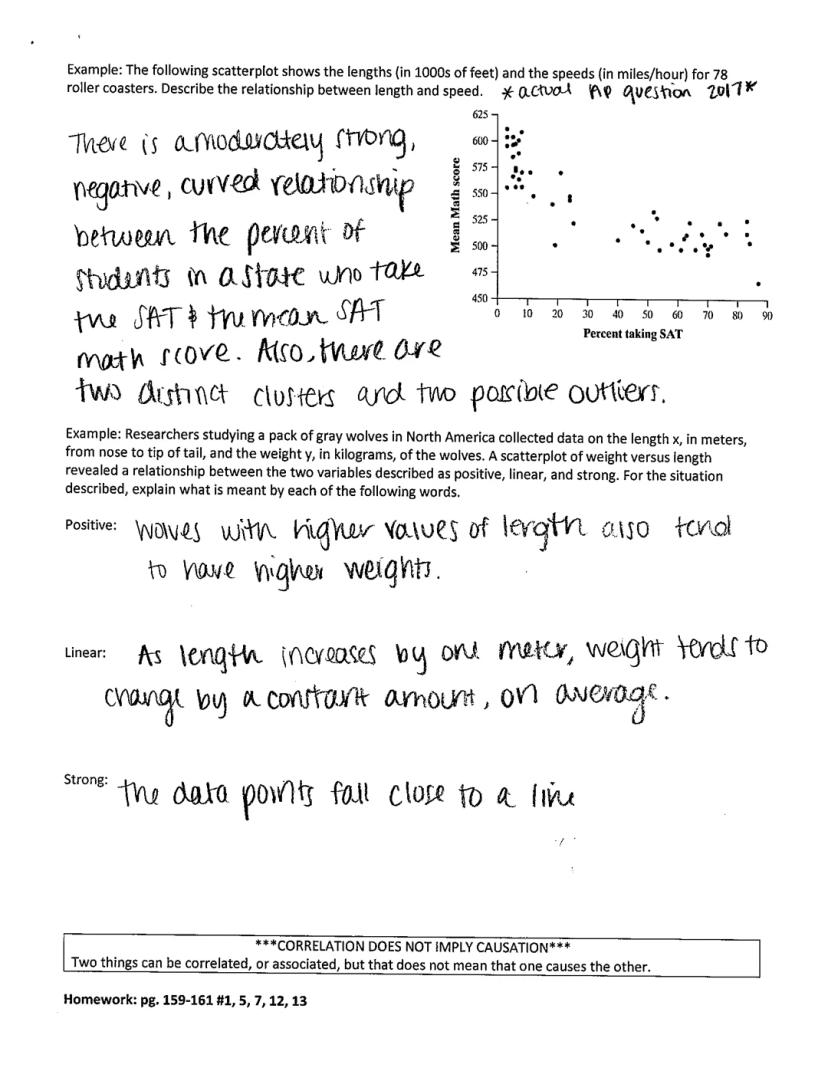
For instance, a scatterplot showing SAT scores and the percentage of students taking the exam might reveal "a moderately strong, negative, curved relationship" with "two distinct clusters and two possible outliers."
Remember that even when two variables show a strong relationship, correlation does not imply causation. Just because two things are associated doesn't mean one causes the other!
3
of 8
Interpreting Relationships
When you describe a relationship as positive, linear, and strong, each term has a specific meaning. Let's break it down:
Positive means that as one variable increases, the other tends to increase too. For example, with wolves, longer wolves tend to be heavier.
Linear means that the relationship follows a straight-line pattern. As one variable increases by one unit, the other variable tends to change by a constant amount, on average.
Strong means the data points fall close to a line or pattern, showing a consistent relationship with minimal scatter.
You might notice distinct patterns in your scatterplots. For example, a scatterplot of SAT math scores versus the percentage of students taking the SAT shows a negative relationship - as more students take the test, average scores tend to decrease.
🔍 When analyzing scatterplots in class, practice identifying the direction, form, and strength of relationships. This skill will help you ace questions on tests and understand real data in the world around you.
4
of 8
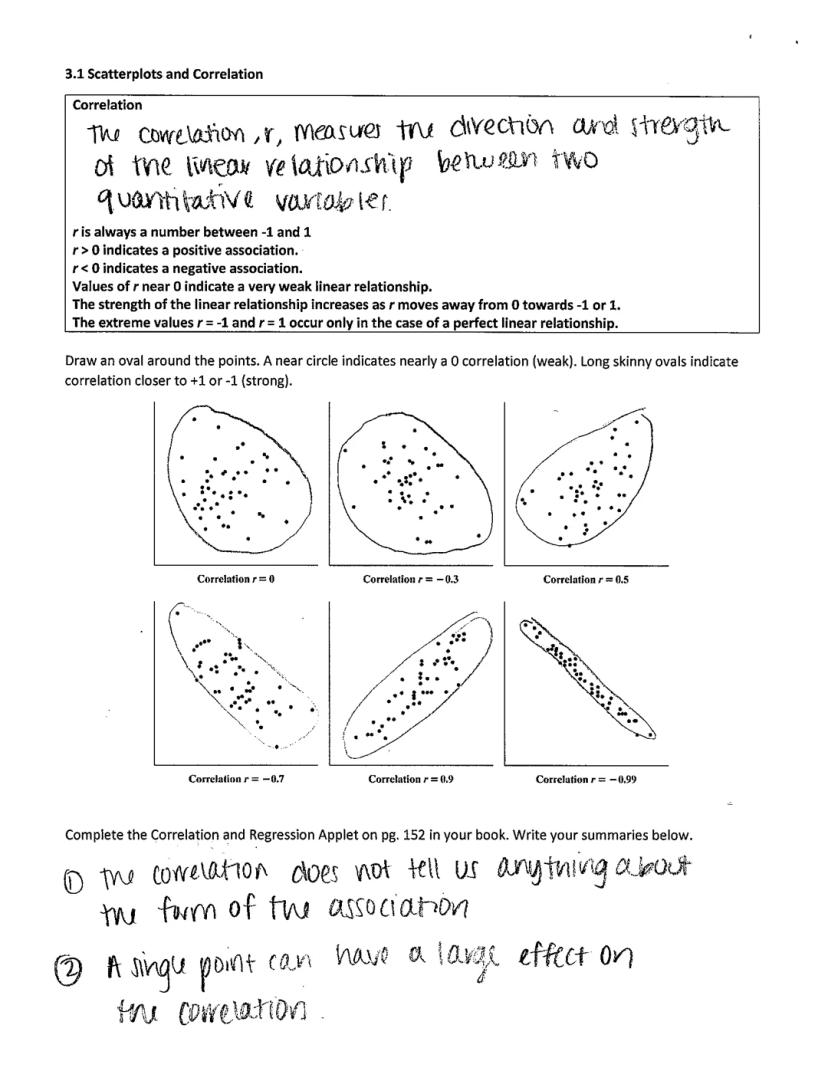
Understanding Correlation
Correlation measures both the direction and strength of a linear relationship between two quantitative variables. This single number tells us a lot about how two variables relate:
- r is always between -1 and +1
- Positive r indicates a positive association (both variables increase together)
- Negative r indicates a negative association (one increases as the other decreases)
- Values near 0 show weak relationships, while values near ±1 show strong relationships
- Perfect correlations only occur with perfect linear relationships
A helpful visual trick: imagine drawing an oval around all points in your scatterplot. A circular shape suggests correlation near 0 (weak), while a long, skinny oval suggests correlation close to ±1 (strong).
Two important limitations to remember about correlation:
- Correlation doesn't tell you about the form of the association (linear vs. non-linear)
- A single outlier can dramatically affect the correlation value
Correlation is powerful but has limitations. Always look at your scatterplot first before relying solely on the r-value to understand a relationship.
5
of 8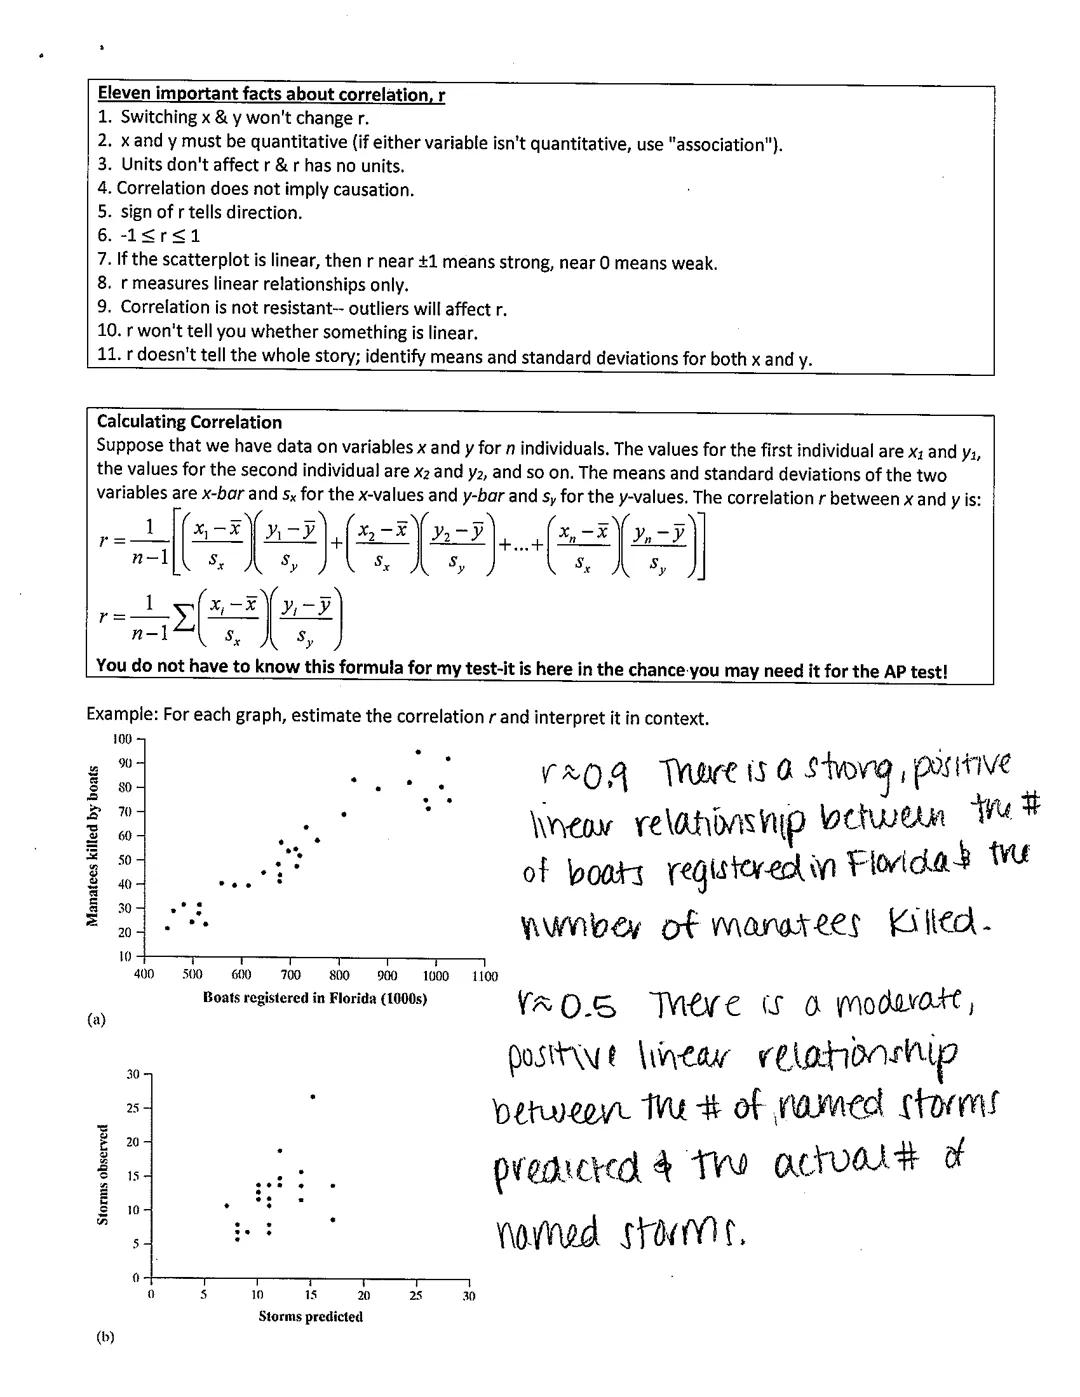
Properties of Correlation
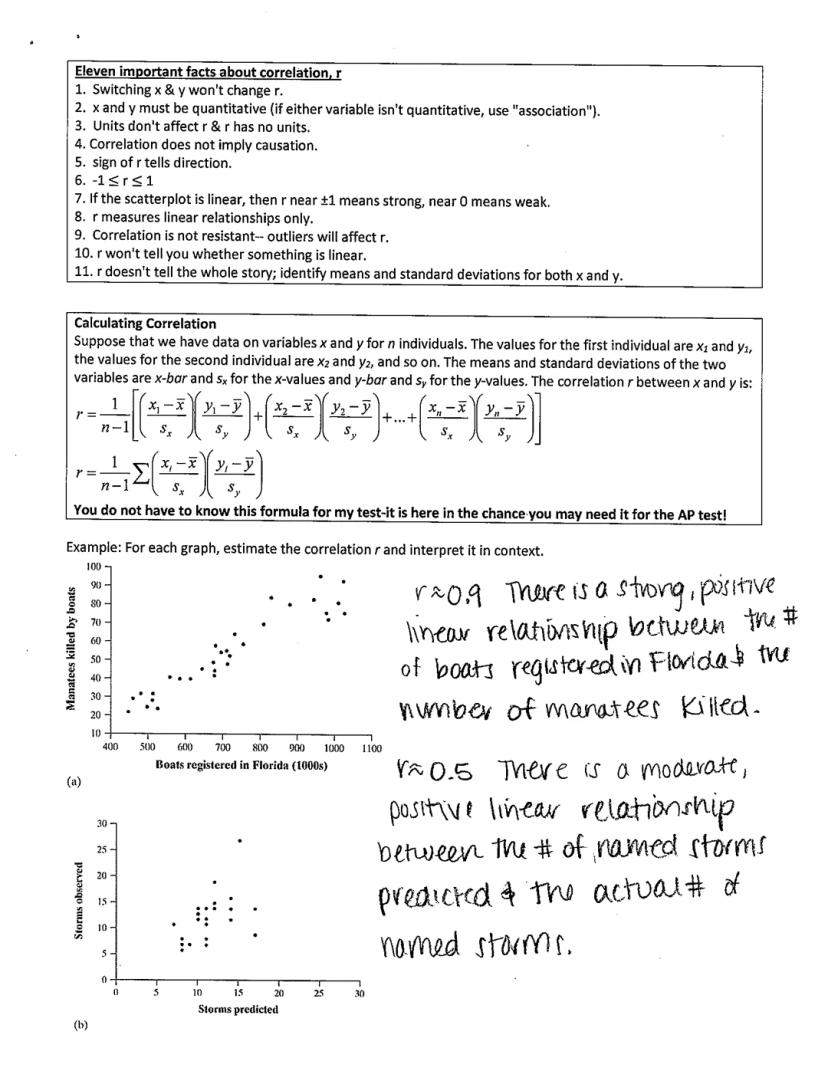
Correlation has several important properties you should know:
- Switching x and y variables won't change r
- Both variables must be quantitative for correlation to work
- Units don't affect r, and r itself has no units
- The sign of r tells you the direction of the relationship
- Correlation values always fall between -1 and +1
- Correlation measures only linear relationships
- Outliers can significantly affect correlation
You can calculate correlation using a complex formula that involves standardized values of each variable, but you'll typically use technology like calculators or software to find r in practice.
When interpreting correlation in context, be specific about what the relationship means. For example, "r ≈ 0.9 indicates a strong, positive linear relationship between the number of boats registered in Florida and the number of manatees killed" gives much more information than simply stating the r-value.
🌟 When interpreting correlation, always connect the numbers to the real-world context. This shows deeper understanding than just stating "r equals 0.9."
6
of 8
More Correlation Examples
Let's practice interpreting correlation in different scenarios:
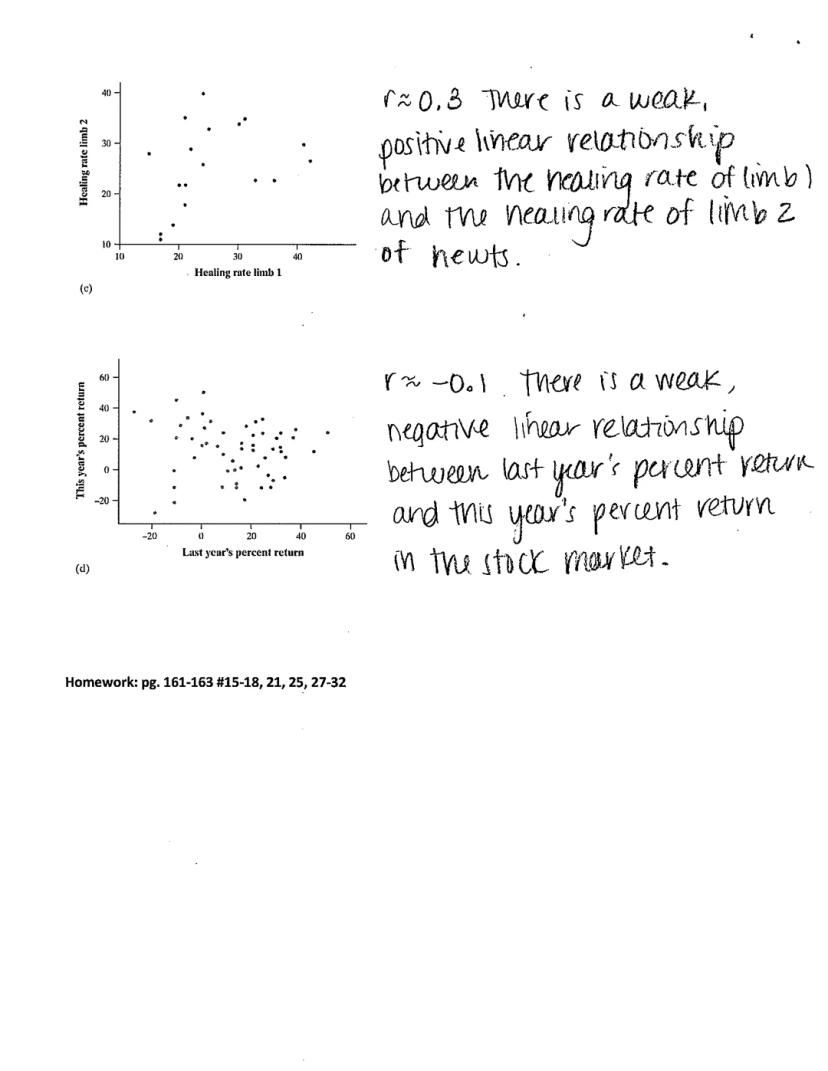
With healing rates in newts, "r ≈ 0.3 indicates a weak, positive linear relationship between the healing rate of limb 1 and limb 2." This means newts that heal quickly in one limb tend to heal somewhat quickly in the other limb, but the relationship isn't very strong.
For stock market returns, "r ≈ -0.1 shows a weak, negative linear relationship between last year's percent return and this year's percent return." This slight negative correlation suggests that good returns last year might slightly predict poorer returns this year, but the relationship is very weak.
Remember to look at the whole picture. Two datasets can have identical correlation values but look completely different when plotted. Correlation is just one tool for understanding relationships, not the complete story.
When describing correlation, include:
- The approximate r-value
- The strength (strong, moderate, or weak)
- The direction (positive or negative)
- The form (linear)
- The context of the variables
This complete description helps you fully understand and communicate what the data is showing.
7
of 8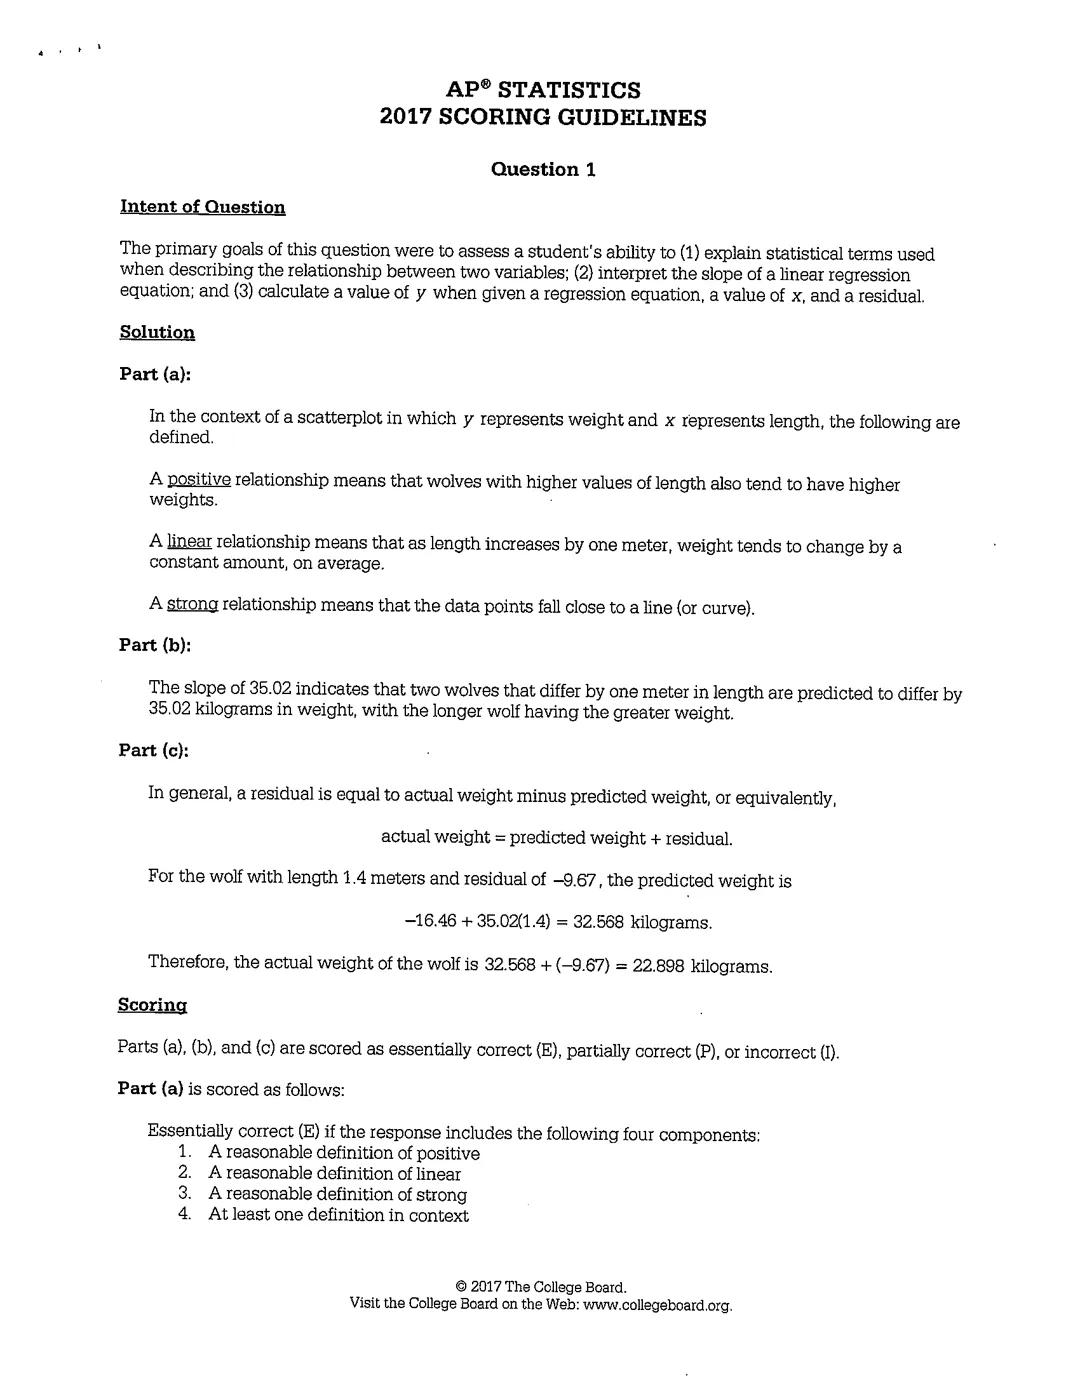
AP Exam Question Skills
The AP Statistics exam often asks you to interpret statistical relationships. Here's what they're looking for:
When explaining terms like positive, linear, and strong:
- Positive: Show you understand that higher values of one variable appear with higher values of the other (e.g., "wolves with higher values of length also tend to have higher weights")
- Linear: Demonstrate that as one variable increases, the other changes by a consistent amount (e.g., "as length increases by one meter, weight tends to change by a constant amount")
- Strong: Explain that data points fall close to the pattern line
For interpreting slope in a regression equation:
- The slope of 35.02 means "two wolves that differ by one meter in length are predicted to differ by 35.02 kilograms in weight, with the longer wolf having the greater weight"
You might also need to calculate values using regression equations and residuals:
- Remember that residual = actual value - predicted value
- So actual value = predicted value + residual
📝 On the AP exam, always include context in your answers. Don't just define terms abstractly - refer to the specific variables mentioned in the problem.
8
of 8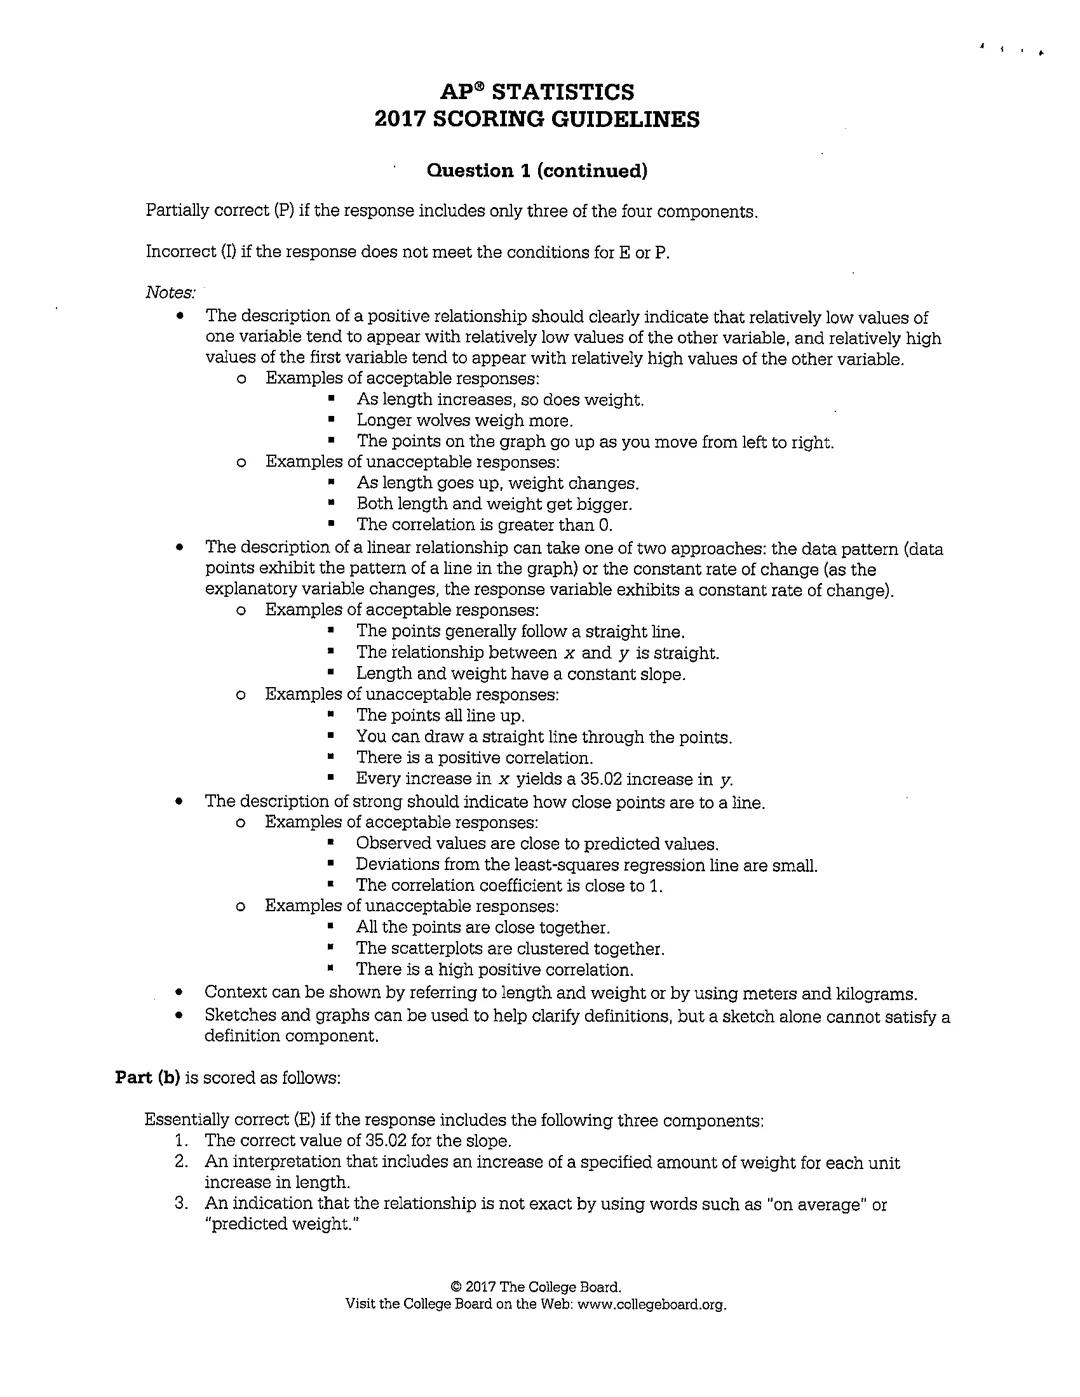
AP Scoring Guidelines
The AP exam rewards precise statistical language and contextual understanding. Here's what earns full credit:
When defining terms like positive, linear, and strong:
- Positive relationship: Clearly show that low values of one variable appear with low values of the other, and high with high (e.g., "As length increases, so does weight")
- Linear relationship: Describe either the visual line pattern or the constant rate of change concept
- Strong relationship: Explain how closely points follow the pattern line
What doesn't work:
- Vague descriptions like "both variables get bigger" or "points are close together"
- Just stating "correlation is greater than 0" without explaining what that means
- Drawing sketches without written explanations
For interpreting slope:
- Include the numerical value (35.02)
- Explain what happens to one variable when the other increases by one unit
- Use qualifying language like "on average" or "predicted" to show the relationship isn't perfect
Remember to always connect statistical concepts to the context of the problem. Generic definitions without application to the specific scenario won't earn full credit on the AP exam.
We thought you’d never ask...
Our AI companion is specifically built for the needs of students. Based on the millions of content pieces we have on the platform we can provide truly meaningful and relevant answers to students. But its not only about answers, the companion is even more about guiding students through their daily learning challenges, with personalised study plans, quizzes or content pieces in the chat and 100% personalisation based on the students skills and developments.
You can download the app in the Google Play Store and in the Apple App Store.
That's right! Enjoy free access to study content, connect with fellow students, and get instant help – all at your fingertips.
Similar Content
Most popular content in AP Statistics
2I
Introduction to Bivariate Quantitative Data
Students will practice identifying explanatory and response variables and interpreting scatterplots for direction, form, strength, and outliers.
9th3180
Hypothesis Testing Project
statistics project using null and alternative hypotheses and how they can be interpreted
20111
Most popular content
9O
Origins and Dynamics of the Columbian Exchange
Analyze the ecological and economic motivations behind the initial transfer of goods, people, and diseases between the Old and New Worlds.
9th3,1280
I
Introduction to Early Cultural Interactions
Analyze the initial social and religious encounters between Europeans, Africans, and Indigenous peoples in the colonial Americas.
9th2,7730
O
Origins of Ancient River Civilizations
Analyze the environmental factors and technological innovations that led to the rise of early states in Mesopotamia, Egypt, and the Indus Valley.
9th3,1870
M
Motivations for European Exploration
Analyze the economic, religious, and political factors that drove European powers to the Americas during the 15th and 16th centuries.
9th1,7780
F
Foundations of Ethical Guidelines in Research
Practice the core principles of the APA ethical code including informed consent, debriefing, and the role of Institutional Review Boards.
9th1,3360
I
Introduction to Native American Societies
Examine the diverse social, political, and economic structures of North American indigenous groups prior to European contact.
9th1,1100
I
Introduction to the Spanish Encomienda System
Explore the fundamental economic and social structures of the Spanish colonial system, focusing on the encomienda and the casta social hierarchy.
9th8890
I
Introduction to Biological Elements of Life
Practice identifying the essential elements including carbon, nitrogen, phosphorus, and sulfur that compose biological macromolecules.
9th1,7410
O
Origins of the Articles of Confederation
Practice identifying the motivations for a weak central government and the specific powers granted to the states under the first U.S. constitution.
9th9370
Students love us — and so will you.
4.6/5App Store
4.7/5Google Play
The app is very easy to use and well designed. I have found everything I was looking for so far and have been able to learn a lot from the presentations! I will definitely use the app for a class assignment! And of course it also helps a lot as an inspiration.
Stefan SiOS user
This app is really great. There are so many study notes and help [...]. My problem subject is French, for example, and the app has so many options for help. Thanks to this app, I have improved my French. I would recommend it to anyone.
Samantha KlichAndroid user
Wow, I am really amazed. I just tried the app because I've seen it advertised many times and was absolutely stunned. This app is THE HELP you want for school and above all, it offers so many things, such as workouts and fact sheets, which have been VERY helpful to me personally.
AnnaiOS user
Understanding Scatterplots and Correlation Made Easy
Ready to dive into the world of data relationships? Let's explore scatterplots and correlation - powerful tools that help us visualize and measure how two variables interact with each other. Understanding these concepts will help you analyze real-world data and...
1
of 8
Sign up to see the content. It's free!
- Access to all documents
- Improve your grades
- Join milions of students
Explanatory and Response Variables
When looking at relationships between variables, it helps to know which one might be influencing the other. An explanatory variable potentially explains or influences changes in another variable, while a response variable measures the outcome we're interested in.
For example, if Pam wants to predict a student's weight based on height, height is the explanatory variable and weight is the response variable. But if Jim just wants to know if there's a relationship between height and weight without predicting one from the other, we can't designate explanatory and response variables.
Creating a scatterplot is the first step in visualizing relationships between two quantitative variables. To make one:
- Put the explanatory variable on the x-axis
- Label and scale both axes appropriately
- Plot each data point as a single dot on the graph
💡 Always remember this rule: the explanatory variable goes on the x-axis and the response variable goes on the y-axis!
2
of 8Sign up to see the content. It's free!
- Access to all documents
- Improve your grades
- Join milions of students
Describing Scatterplots
Once you've created a scatterplot, you need to analyze what it shows. Look for overall patterns and any unusual points that stand out. Describe the relationship by examining three key characteristics:
Direction: Is the relationship positive (points trend upward), negative (points trend downward), or is there no clear direction?
Form: Do the points roughly follow a straight line (linear), a curve, or are they scattered randomly?
Strength: How closely do the points follow the pattern? Strong relationships have points clustered tightly around a pattern, while weak ones have more scattered points.
You should also look for any outliers (individual points that fall outside the overall pattern) and clusters (groups of points that seem to form their own pattern).
For instance, a scatterplot showing SAT scores and the percentage of students taking the exam might reveal "a moderately strong, negative, curved relationship" with "two distinct clusters and two possible outliers."
Remember that even when two variables show a strong relationship, correlation does not imply causation. Just because two things are associated doesn't mean one causes the other!
3
of 8Sign up to see the content. It's free!
- Access to all documents
- Improve your grades
- Join milions of students
Interpreting Relationships
When you describe a relationship as positive, linear, and strong, each term has a specific meaning. Let's break it down:
Positive means that as one variable increases, the other tends to increase too. For example, with wolves, longer wolves tend to be heavier.
Linear means that the relationship follows a straight-line pattern. As one variable increases by one unit, the other variable tends to change by a constant amount, on average.
Strong means the data points fall close to a line or pattern, showing a consistent relationship with minimal scatter.
You might notice distinct patterns in your scatterplots. For example, a scatterplot of SAT math scores versus the percentage of students taking the SAT shows a negative relationship - as more students take the test, average scores tend to decrease.
🔍 When analyzing scatterplots in class, practice identifying the direction, form, and strength of relationships. This skill will help you ace questions on tests and understand real data in the world around you.
4
of 8Sign up to see the content. It's free!
- Access to all documents
- Improve your grades
- Join milions of students
Understanding Correlation
Correlation measures both the direction and strength of a linear relationship between two quantitative variables. This single number tells us a lot about how two variables relate:
- r is always between -1 and +1
- Positive r indicates a positive association (both variables increase together)
- Negative r indicates a negative association (one increases as the other decreases)
- Values near 0 show weak relationships, while values near ±1 show strong relationships
- Perfect correlations only occur with perfect linear relationships
A helpful visual trick: imagine drawing an oval around all points in your scatterplot. A circular shape suggests correlation near 0 (weak), while a long, skinny oval suggests correlation close to ±1 (strong).
Two important limitations to remember about correlation:
- Correlation doesn't tell you about the form of the association (linear vs. non-linear)
- A single outlier can dramatically affect the correlation value
Correlation is powerful but has limitations. Always look at your scatterplot first before relying solely on the r-value to understand a relationship.
5
of 8Sign up to see the content. It's free!
- Access to all documents
- Improve your grades
- Join milions of students
Properties of Correlation
Correlation has several important properties you should know:
- Switching x and y variables won't change r
- Both variables must be quantitative for correlation to work
- Units don't affect r, and r itself has no units
- The sign of r tells you the direction of the relationship
- Correlation values always fall between -1 and +1
- Correlation measures only linear relationships
- Outliers can significantly affect correlation
You can calculate correlation using a complex formula that involves standardized values of each variable, but you'll typically use technology like calculators or software to find r in practice.
When interpreting correlation in context, be specific about what the relationship means. For example, "r ≈ 0.9 indicates a strong, positive linear relationship between the number of boats registered in Florida and the number of manatees killed" gives much more information than simply stating the r-value.
🌟 When interpreting correlation, always connect the numbers to the real-world context. This shows deeper understanding than just stating "r equals 0.9."
6
of 8Sign up to see the content. It's free!
- Access to all documents
- Improve your grades
- Join milions of students
More Correlation Examples
Let's practice interpreting correlation in different scenarios:
With healing rates in newts, "r ≈ 0.3 indicates a weak, positive linear relationship between the healing rate of limb 1 and limb 2." This means newts that heal quickly in one limb tend to heal somewhat quickly in the other limb, but the relationship isn't very strong.
For stock market returns, "r ≈ -0.1 shows a weak, negative linear relationship between last year's percent return and this year's percent return." This slight negative correlation suggests that good returns last year might slightly predict poorer returns this year, but the relationship is very weak.
Remember to look at the whole picture. Two datasets can have identical correlation values but look completely different when plotted. Correlation is just one tool for understanding relationships, not the complete story.
When describing correlation, include:
- The approximate r-value
- The strength (strong, moderate, or weak)
- The direction (positive or negative)
- The form (linear)
- The context of the variables
This complete description helps you fully understand and communicate what the data is showing.
7
of 8Sign up to see the content. It's free!
- Access to all documents
- Improve your grades
- Join milions of students
AP Exam Question Skills
The AP Statistics exam often asks you to interpret statistical relationships. Here's what they're looking for:
When explaining terms like positive, linear, and strong:
- Positive: Show you understand that higher values of one variable appear with higher values of the other (e.g., "wolves with higher values of length also tend to have higher weights")
- Linear: Demonstrate that as one variable increases, the other changes by a consistent amount (e.g., "as length increases by one meter, weight tends to change by a constant amount")
- Strong: Explain that data points fall close to the pattern line
For interpreting slope in a regression equation:
- The slope of 35.02 means "two wolves that differ by one meter in length are predicted to differ by 35.02 kilograms in weight, with the longer wolf having the greater weight"
You might also need to calculate values using regression equations and residuals:
- Remember that residual = actual value - predicted value
- So actual value = predicted value + residual
📝 On the AP exam, always include context in your answers. Don't just define terms abstractly - refer to the specific variables mentioned in the problem.
8
of 8Sign up to see the content. It's free!
- Access to all documents
- Improve your grades
- Join milions of students
AP Scoring Guidelines
The AP exam rewards precise statistical language and contextual understanding. Here's what earns full credit:
When defining terms like positive, linear, and strong:
- Positive relationship: Clearly show that low values of one variable appear with low values of the other, and high with high (e.g., "As length increases, so does weight")
- Linear relationship: Describe either the visual line pattern or the constant rate of change concept
- Strong relationship: Explain how closely points follow the pattern line
What doesn't work:
- Vague descriptions like "both variables get bigger" or "points are close together"
- Just stating "correlation is greater than 0" without explaining what that means
- Drawing sketches without written explanations
For interpreting slope:
- Include the numerical value (35.02)
- Explain what happens to one variable when the other increases by one unit
- Use qualifying language like "on average" or "predicted" to show the relationship isn't perfect
Remember to always connect statistical concepts to the context of the problem. Generic definitions without application to the specific scenario won't earn full credit on the AP exam.
We thought you’d never ask...
Our AI companion is specifically built for the needs of students. Based on the millions of content pieces we have on the platform we can provide truly meaningful and relevant answers to students. But its not only about answers, the companion is even more about guiding students through their daily learning challenges, with personalised study plans, quizzes or content pieces in the chat and 100% personalisation based on the students skills and developments.
You can download the app in the Google Play Store and in the Apple App Store.
That's right! Enjoy free access to study content, connect with fellow students, and get instant help – all at your fingertips.
Similar Content
Most popular content in AP Statistics
2I
Introduction to Bivariate Quantitative Data
Students will practice identifying explanatory and response variables and interpreting scatterplots for direction, form, strength, and outliers.
9th3180
Hypothesis Testing Project
statistics project using null and alternative hypotheses and how they can be interpreted
20111
Most popular content
9O
Origins and Dynamics of the Columbian Exchange
Analyze the ecological and economic motivations behind the initial transfer of goods, people, and diseases between the Old and New Worlds.
9th3,1280
I
Introduction to Early Cultural Interactions
Analyze the initial social and religious encounters between Europeans, Africans, and Indigenous peoples in the colonial Americas.
9th2,7730
O
Origins of Ancient River Civilizations
Analyze the environmental factors and technological innovations that led to the rise of early states in Mesopotamia, Egypt, and the Indus Valley.
9th3,1870
M
Motivations for European Exploration
Analyze the economic, religious, and political factors that drove European powers to the Americas during the 15th and 16th centuries.
9th1,7780
F
Foundations of Ethical Guidelines in Research
Practice the core principles of the APA ethical code including informed consent, debriefing, and the role of Institutional Review Boards.
9th1,3360
I
Introduction to Native American Societies
Examine the diverse social, political, and economic structures of North American indigenous groups prior to European contact.
9th1,1100
I
Introduction to the Spanish Encomienda System
Explore the fundamental economic and social structures of the Spanish colonial system, focusing on the encomienda and the casta social hierarchy.
9th8890
I
Introduction to Biological Elements of Life
Practice identifying the essential elements including carbon, nitrogen, phosphorus, and sulfur that compose biological macromolecules.
9th1,7410
O
Origins of the Articles of Confederation
Practice identifying the motivations for a weak central government and the specific powers granted to the states under the first U.S. constitution.
9th9370
Students love us — and so will you.
4.6/5App Store
4.7/5Google Play
The app is very easy to use and well designed. I have found everything I was looking for so far and have been able to learn a lot from the presentations! I will definitely use the app for a class assignment! And of course it also helps a lot as an inspiration.
Stefan SiOS user
This app is really great. There are so many study notes and help [...]. My problem subject is French, for example, and the app has so many options for help. Thanks to this app, I have improved my French. I would recommend it to anyone.
Samantha KlichAndroid user
Wow, I am really amazed. I just tried the app because I've seen it advertised many times and was absolutely stunned. This app is THE HELP you want for school and above all, it offers so many things, such as workouts and fact sheets, which have been VERY helpful to me personally.
AnnaiOS user