Ready to test your understanding of statistics? This AP Statistics...
Comprehensive Guide to Statistics Chapter 1


1 / 4
1
of 4
Understanding Data Distributions and Summary Statistics
When analyzing histograms, knowing how to identify the mean and median is crucial. In skewed distributions, these measures often appear in different positions - for example, in right-skewed distributions, the mean is typically pulled toward the tail (greater than the median).
Five-number summaries provide a comprehensive picture of data distribution. They include the minimum, first quartile (Q1), median, third quartile (Q3), and maximum values. When given the five-number summary and sample size, you can estimate how many observations fall between specific quartiles - approximately 25% of observations fall in each section.
Bar graphs show comparisons between categories. When interpreting them, be careful about drawing conclusions beyond what the data actually shows. A well-designed bar graph lets you compare values accurately, but doesn't necessarily indicate information about sample sizes or other variables not displayed.
Pro Tip: When data values change in a dataset, the mean is affected by every value change, while the median may stay the same if the relative position of the middle value remains unchanged.
Correctly understanding how changes to data affect statistical measures helps you interpret and analyze datasets accurately. For instance, changing a single value in a large dataset will shift the mean in that direction, but may not affect the median at all if the changed value doesn't cross the median.
2
of 4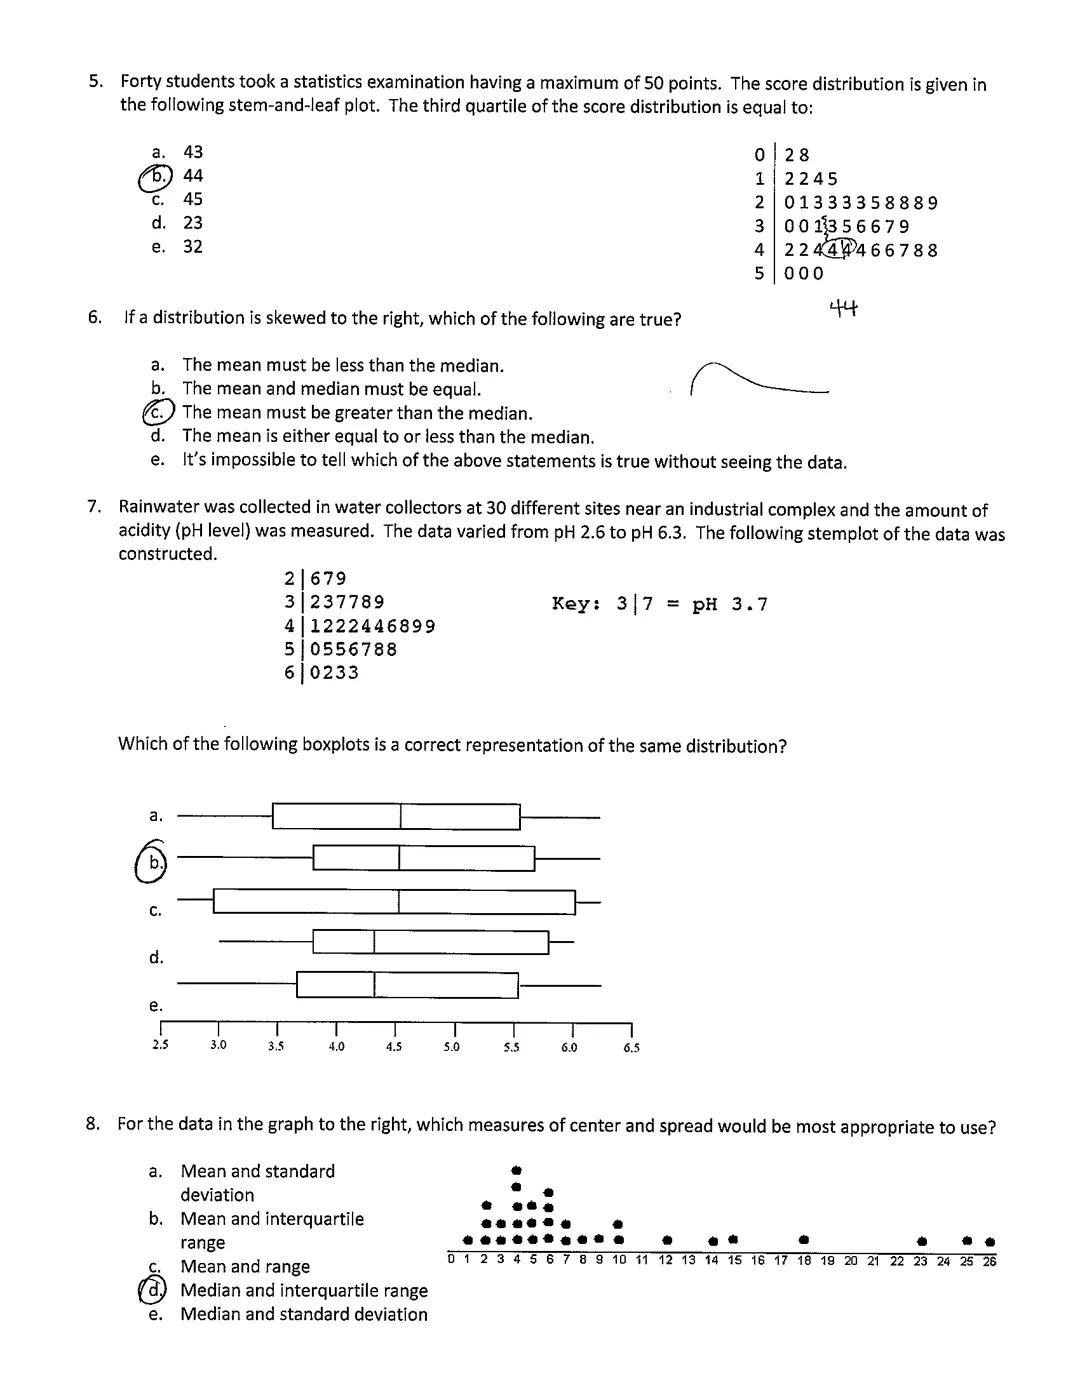
Data Representation and Selecting Appropriate Statistics
Stem-and-leaf plots organize data to show both individual values and the overall distribution shape. When reading these plots, you can identify quartiles by finding the values that divide the dataset into four equal parts. The third quartile (Q3) represents the 75th percentile of your data.
Boxplots (box-and-whisker plots) visually represent the five-number summary. They're particularly useful for identifying outliers and comparing distributions. When converting from a stemplot to a boxplot, ensure you maintain the same distribution characteristics, including the median, quartiles, and range.
Choosing appropriate measures depends on your data's distribution. For symmetric distributions, mean and standard deviation work well. For skewed or outlier-heavy data, median and interquartile range (IQR) provide better summaries since they're resistant to extreme values.
Remember: The shape of your data determines which statistics to use. If you see a highly skewed distribution, median and IQR will give you a more accurate picture than mean and standard deviation.
When examining a dataset with extreme values or clear skew, consider how these characteristics affect different statistical measures. Symmetric distributions are well-described by mean and standard deviation, while skewed distributions are better summarized using median and IQR.
3
of 4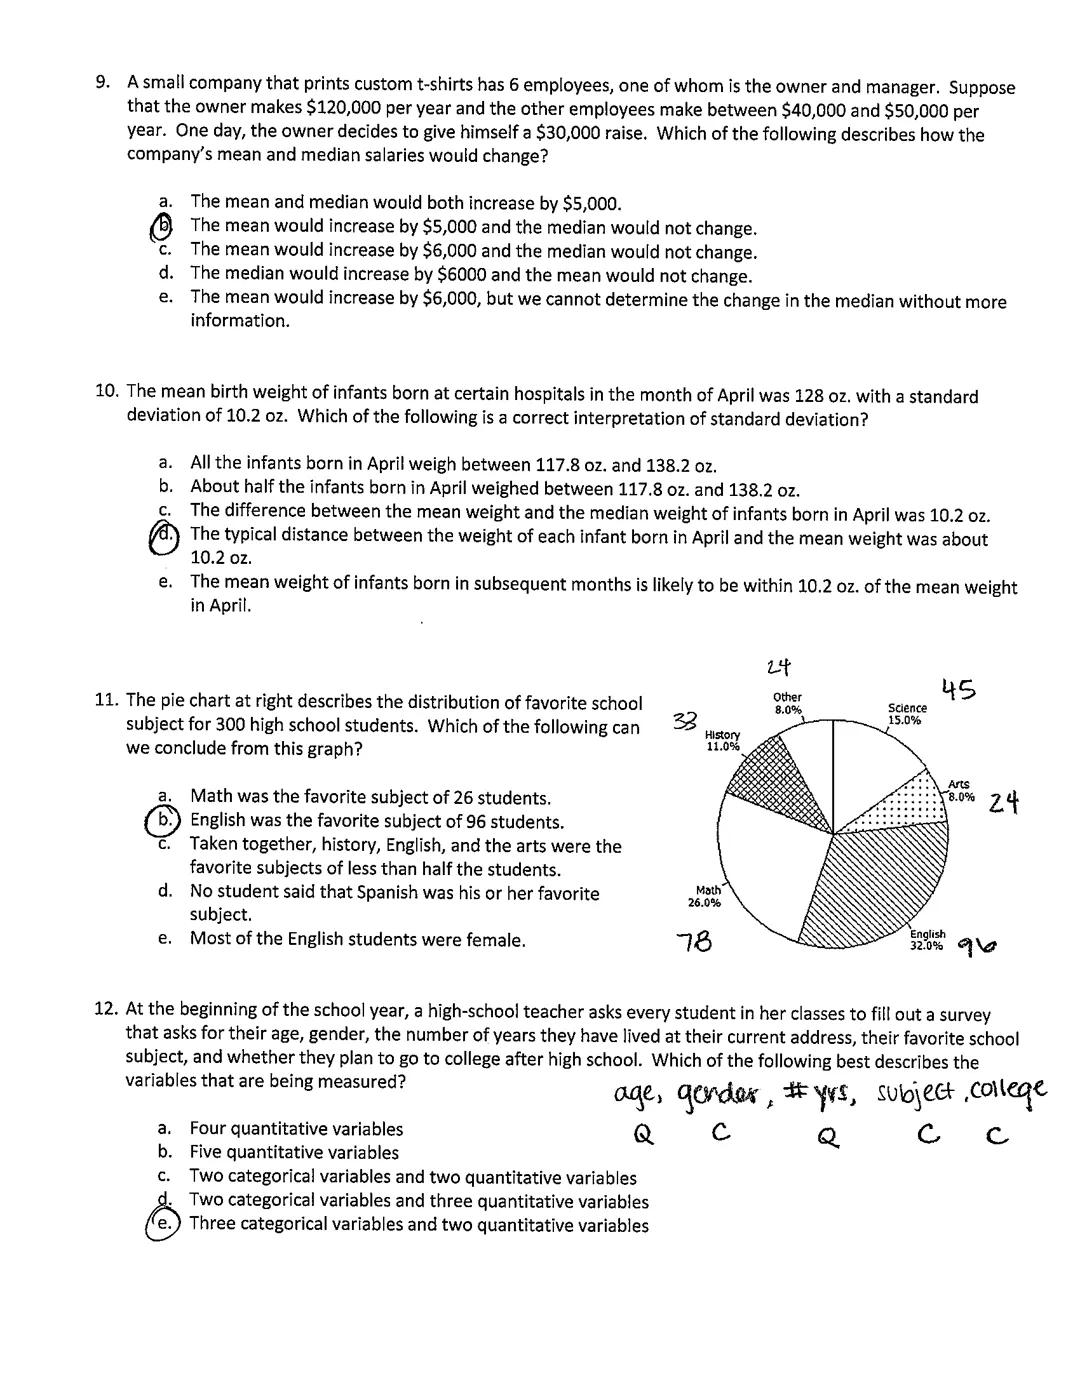
Interpreting Statistical Measures and Classifying Variables
Salary data often contains outliers that significantly impact the mean but not the median. When the highest salary increases in a small company, the mean increases proportionally to the change divided by the number of employees, while the median may remain completely unchanged if the same person remains in the middle position.
The standard deviation measures the typical distance of observations from the mean. It tells you how spread out your data is - a larger standard deviation indicates more variability. About 68% of observations in a normal distribution fall within one standard deviation of the mean.
Pie charts display parts of a whole, with each slice representing a proportion of the total. To interpret a pie chart correctly, remember that the entire circle represents 100% of the data. You can determine the count for each category by multiplying its percentage by the total sample size.
Heads Up: When classifying variables, remember that categorical variables place individuals into groups (like gender or favorite subject), while quantitative variables represent measurements (like age or years at an address).
Properly identifying variable types is essential for choosing appropriate statistical methods. Categorical variables are analyzed using counts, proportions, and bar charts, while quantitative variables can be summarized with measures like mean, median, and standard deviation.
4
of 4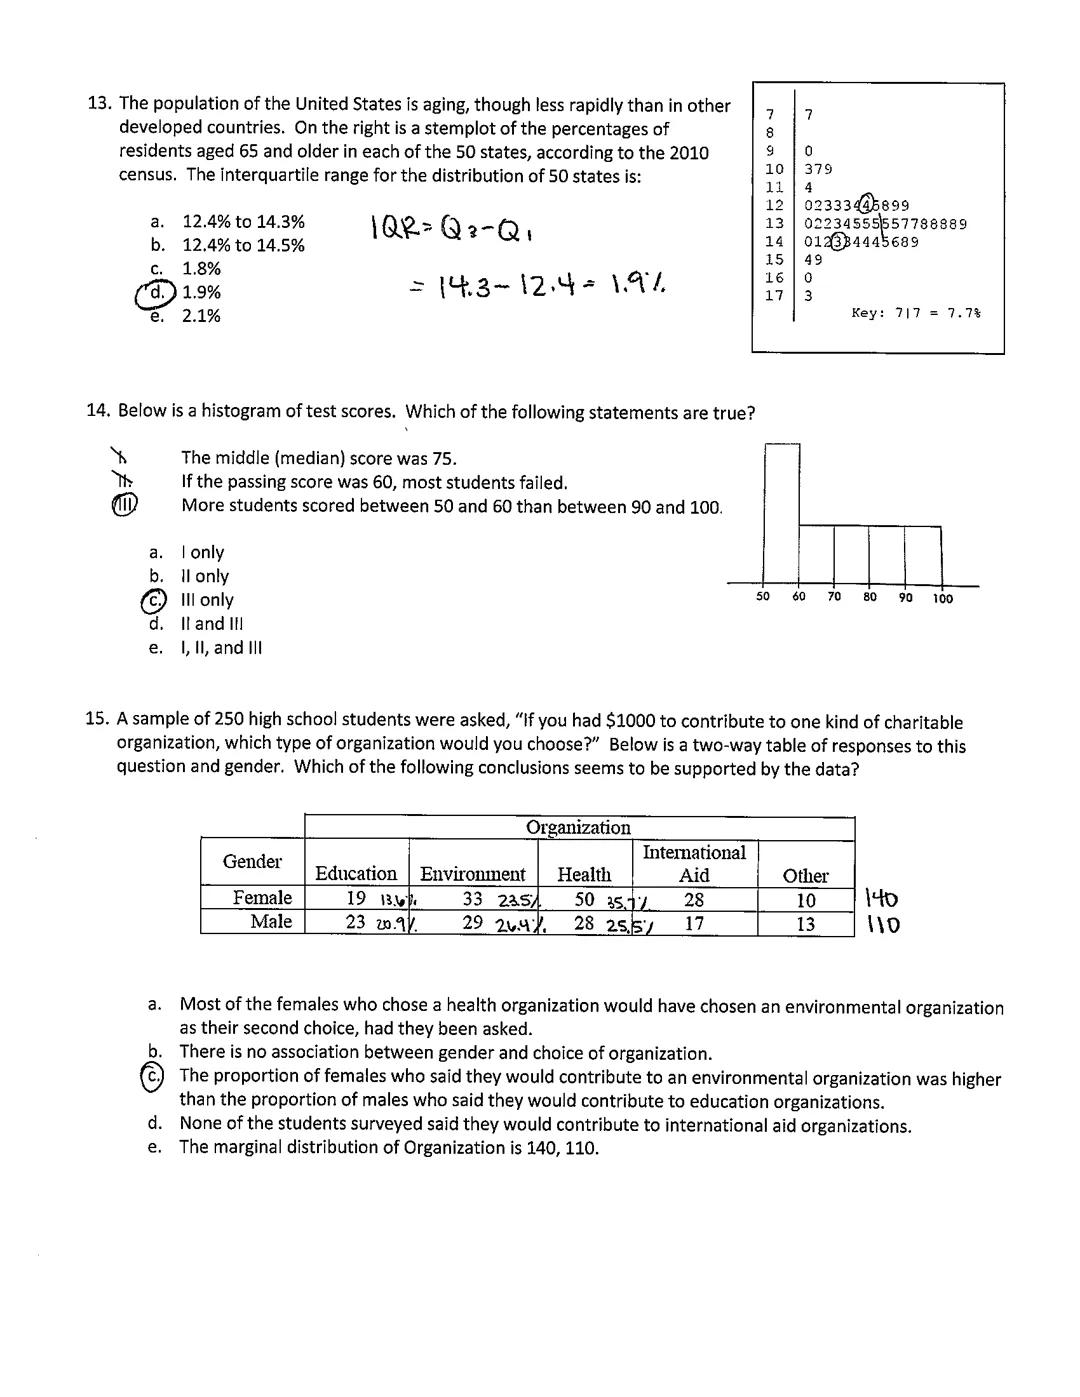
Statistical Analysis and Interpretation
Stemplots provide a detailed view of data distribution. To find the interquartile range (IQR), locate the first quartile (Q1) and third quartile (Q3), then calculate Q3-Q1. The IQR represents the middle 50% of your data and is a robust measure of spread that's not affected by outliers.
When interpreting histograms, focus on overall shape, center, and spread. Look for where data clusters and identify any skewness or unusual patterns. The histogram's shape tells you which statistical measures are most appropriate for describing the data.
Two-way tables show relationships between two categorical variables. When analyzing these tables, compare the distributions within each category to identify potential associations. Look at conditional distributions (percentages within categories) rather than just raw counts to make valid comparisons.
Quick Tip: When analyzing categorical data in two-way tables, compare percentages within categories (conditional distributions) rather than raw counts to identify meaningful associations.
Statistical interpretation requires careful attention to what the data actually shows. Avoid making assumptions beyond what's presented in the graph or table. Proper statistical reasoning means drawing conclusions only when the evidence clearly supports them.
We thought you’d never ask...
Our AI companion is specifically built for the needs of students. Based on the millions of content pieces we have on the platform we can provide truly meaningful and relevant answers to students. But its not only about answers, the companion is even more about guiding students through their daily learning challenges, with personalised study plans, quizzes or content pieces in the chat and 100% personalisation based on the students skills and developments.
You can download the app in the Google Play Store and in the Apple App Store.
That's right! Enjoy free access to study content, connect with fellow students, and get instant help – all at your fingertips.
Similar Content
Most popular content in AP Statistics
2I
Introduction to Bivariate Quantitative Data
Students will practice identifying explanatory and response variables and interpreting scatterplots for direction, form, strength, and outliers.
9th3180
Hypothesis Testing Project
statistics project using null and alternative hypotheses and how they can be interpreted
20111
Most popular content
9O
Origins and Dynamics of the Columbian Exchange
Analyze the ecological and economic motivations behind the initial transfer of goods, people, and diseases between the Old and New Worlds.
9th3,1280
I
Introduction to Early Cultural Interactions
Analyze the initial social and religious encounters between Europeans, Africans, and Indigenous peoples in the colonial Americas.
9th2,7730
O
Origins of Ancient River Civilizations
Analyze the environmental factors and technological innovations that led to the rise of early states in Mesopotamia, Egypt, and the Indus Valley.
9th3,1870
M
Motivations for European Exploration
Analyze the economic, religious, and political factors that drove European powers to the Americas during the 15th and 16th centuries.
9th1,7780
F
Foundations of Ethical Guidelines in Research
Practice the core principles of the APA ethical code including informed consent, debriefing, and the role of Institutional Review Boards.
9th1,3360
I
Introduction to Native American Societies
Examine the diverse social, political, and economic structures of North American indigenous groups prior to European contact.
9th1,1100
I
Introduction to the Spanish Encomienda System
Explore the fundamental economic and social structures of the Spanish colonial system, focusing on the encomienda and the casta social hierarchy.
9th8890
I
Introduction to Biological Elements of Life
Practice identifying the essential elements including carbon, nitrogen, phosphorus, and sulfur that compose biological macromolecules.
9th1,7410
O
Origins of the Articles of Confederation
Practice identifying the motivations for a weak central government and the specific powers granted to the states under the first U.S. constitution.
9th9370
Students love us — and so will you.
4.6/5App Store
4.7/5Google Play
The app is very easy to use and well designed. I have found everything I was looking for so far and have been able to learn a lot from the presentations! I will definitely use the app for a class assignment! And of course it also helps a lot as an inspiration.
Stefan SiOS user
This app is really great. There are so many study notes and help [...]. My problem subject is French, for example, and the app has so many options for help. Thanks to this app, I have improved my French. I would recommend it to anyone.
Samantha KlichAndroid user
Wow, I am really amazed. I just tried the app because I've seen it advertised many times and was absolutely stunned. This app is THE HELP you want for school and above all, it offers so many things, such as workouts and fact sheets, which have been VERY helpful to me personally.
AnnaiOS user
Comprehensive Guide to Statistics Chapter 1
Ready to test your understanding of statistics? This AP Statistics practice set covers key concepts like data distributions, measures of center and spread, and data representation techniques. These multiple-choice questions will help you prepare for the exam while reinforcing essential...
1
of 4
Sign up to see the content. It's free!
- Access to all documents
- Improve your grades
- Join milions of students
Understanding Data Distributions and Summary Statistics
When analyzing histograms, knowing how to identify the mean and median is crucial. In skewed distributions, these measures often appear in different positions - for example, in right-skewed distributions, the mean is typically pulled toward the tail (greater than the median).
Five-number summaries provide a comprehensive picture of data distribution. They include the minimum, first quartile (Q1), median, third quartile (Q3), and maximum values. When given the five-number summary and sample size, you can estimate how many observations fall between specific quartiles - approximately 25% of observations fall in each section.
Bar graphs show comparisons between categories. When interpreting them, be careful about drawing conclusions beyond what the data actually shows. A well-designed bar graph lets you compare values accurately, but doesn't necessarily indicate information about sample sizes or other variables not displayed.
Pro Tip: When data values change in a dataset, the mean is affected by every value change, while the median may stay the same if the relative position of the middle value remains unchanged.
Correctly understanding how changes to data affect statistical measures helps you interpret and analyze datasets accurately. For instance, changing a single value in a large dataset will shift the mean in that direction, but may not affect the median at all if the changed value doesn't cross the median.
2
of 4Sign up to see the content. It's free!
- Access to all documents
- Improve your grades
- Join milions of students
Data Representation and Selecting Appropriate Statistics
Stem-and-leaf plots organize data to show both individual values and the overall distribution shape. When reading these plots, you can identify quartiles by finding the values that divide the dataset into four equal parts. The third quartile (Q3) represents the 75th percentile of your data.
Boxplots (box-and-whisker plots) visually represent the five-number summary. They're particularly useful for identifying outliers and comparing distributions. When converting from a stemplot to a boxplot, ensure you maintain the same distribution characteristics, including the median, quartiles, and range.
Choosing appropriate measures depends on your data's distribution. For symmetric distributions, mean and standard deviation work well. For skewed or outlier-heavy data, median and interquartile range (IQR) provide better summaries since they're resistant to extreme values.
Remember: The shape of your data determines which statistics to use. If you see a highly skewed distribution, median and IQR will give you a more accurate picture than mean and standard deviation.
When examining a dataset with extreme values or clear skew, consider how these characteristics affect different statistical measures. Symmetric distributions are well-described by mean and standard deviation, while skewed distributions are better summarized using median and IQR.
3
of 4Sign up to see the content. It's free!
- Access to all documents
- Improve your grades
- Join milions of students
Interpreting Statistical Measures and Classifying Variables
Salary data often contains outliers that significantly impact the mean but not the median. When the highest salary increases in a small company, the mean increases proportionally to the change divided by the number of employees, while the median may remain completely unchanged if the same person remains in the middle position.
The standard deviation measures the typical distance of observations from the mean. It tells you how spread out your data is - a larger standard deviation indicates more variability. About 68% of observations in a normal distribution fall within one standard deviation of the mean.
Pie charts display parts of a whole, with each slice representing a proportion of the total. To interpret a pie chart correctly, remember that the entire circle represents 100% of the data. You can determine the count for each category by multiplying its percentage by the total sample size.
Heads Up: When classifying variables, remember that categorical variables place individuals into groups (like gender or favorite subject), while quantitative variables represent measurements (like age or years at an address).
Properly identifying variable types is essential for choosing appropriate statistical methods. Categorical variables are analyzed using counts, proportions, and bar charts, while quantitative variables can be summarized with measures like mean, median, and standard deviation.
4
of 4Sign up to see the content. It's free!
- Access to all documents
- Improve your grades
- Join milions of students
Statistical Analysis and Interpretation
Stemplots provide a detailed view of data distribution. To find the interquartile range (IQR), locate the first quartile (Q1) and third quartile (Q3), then calculate Q3-Q1. The IQR represents the middle 50% of your data and is a robust measure of spread that's not affected by outliers.
When interpreting histograms, focus on overall shape, center, and spread. Look for where data clusters and identify any skewness or unusual patterns. The histogram's shape tells you which statistical measures are most appropriate for describing the data.
Two-way tables show relationships between two categorical variables. When analyzing these tables, compare the distributions within each category to identify potential associations. Look at conditional distributions (percentages within categories) rather than just raw counts to make valid comparisons.
Quick Tip: When analyzing categorical data in two-way tables, compare percentages within categories (conditional distributions) rather than raw counts to identify meaningful associations.
Statistical interpretation requires careful attention to what the data actually shows. Avoid making assumptions beyond what's presented in the graph or table. Proper statistical reasoning means drawing conclusions only when the evidence clearly supports them.
We thought you’d never ask...
Our AI companion is specifically built for the needs of students. Based on the millions of content pieces we have on the platform we can provide truly meaningful and relevant answers to students. But its not only about answers, the companion is even more about guiding students through their daily learning challenges, with personalised study plans, quizzes or content pieces in the chat and 100% personalisation based on the students skills and developments.
You can download the app in the Google Play Store and in the Apple App Store.
That's right! Enjoy free access to study content, connect with fellow students, and get instant help – all at your fingertips.
Similar Content
Most popular content in AP Statistics
2I
Introduction to Bivariate Quantitative Data
Students will practice identifying explanatory and response variables and interpreting scatterplots for direction, form, strength, and outliers.
9th3180
Hypothesis Testing Project
statistics project using null and alternative hypotheses and how they can be interpreted
20111
Most popular content
9O
Origins and Dynamics of the Columbian Exchange
Analyze the ecological and economic motivations behind the initial transfer of goods, people, and diseases between the Old and New Worlds.
9th3,1280
I
Introduction to Early Cultural Interactions
Analyze the initial social and religious encounters between Europeans, Africans, and Indigenous peoples in the colonial Americas.
9th2,7730
O
Origins of Ancient River Civilizations
Analyze the environmental factors and technological innovations that led to the rise of early states in Mesopotamia, Egypt, and the Indus Valley.
9th3,1870
M
Motivations for European Exploration
Analyze the economic, religious, and political factors that drove European powers to the Americas during the 15th and 16th centuries.
9th1,7780
F
Foundations of Ethical Guidelines in Research
Practice the core principles of the APA ethical code including informed consent, debriefing, and the role of Institutional Review Boards.
9th1,3360
I
Introduction to Native American Societies
Examine the diverse social, political, and economic structures of North American indigenous groups prior to European contact.
9th1,1100
I
Introduction to the Spanish Encomienda System
Explore the fundamental economic and social structures of the Spanish colonial system, focusing on the encomienda and the casta social hierarchy.
9th8890
I
Introduction to Biological Elements of Life
Practice identifying the essential elements including carbon, nitrogen, phosphorus, and sulfur that compose biological macromolecules.
9th1,7410
O
Origins of the Articles of Confederation
Practice identifying the motivations for a weak central government and the specific powers granted to the states under the first U.S. constitution.
9th9370
Students love us — and so will you.
4.6/5App Store
4.7/5Google Play
The app is very easy to use and well designed. I have found everything I was looking for so far and have been able to learn a lot from the presentations! I will definitely use the app for a class assignment! And of course it also helps a lot as an inspiration.
Stefan SiOS user
This app is really great. There are so many study notes and help [...]. My problem subject is French, for example, and the app has so many options for help. Thanks to this app, I have improved my French. I would recommend it to anyone.
Samantha KlichAndroid user
Wow, I am really amazed. I just tried the app because I've seen it advertised many times and was absolutely stunned. This app is THE HELP you want for school and above all, it offers so many things, such as workouts and fact sheets, which have been VERY helpful to me personally.
AnnaiOS user