Economics may seem complex, but it's really about understanding how...
Comprehensive Unit 2 Microeconomics Definitions Guide
Anna@autumn_anna
1 / 4
1
of 4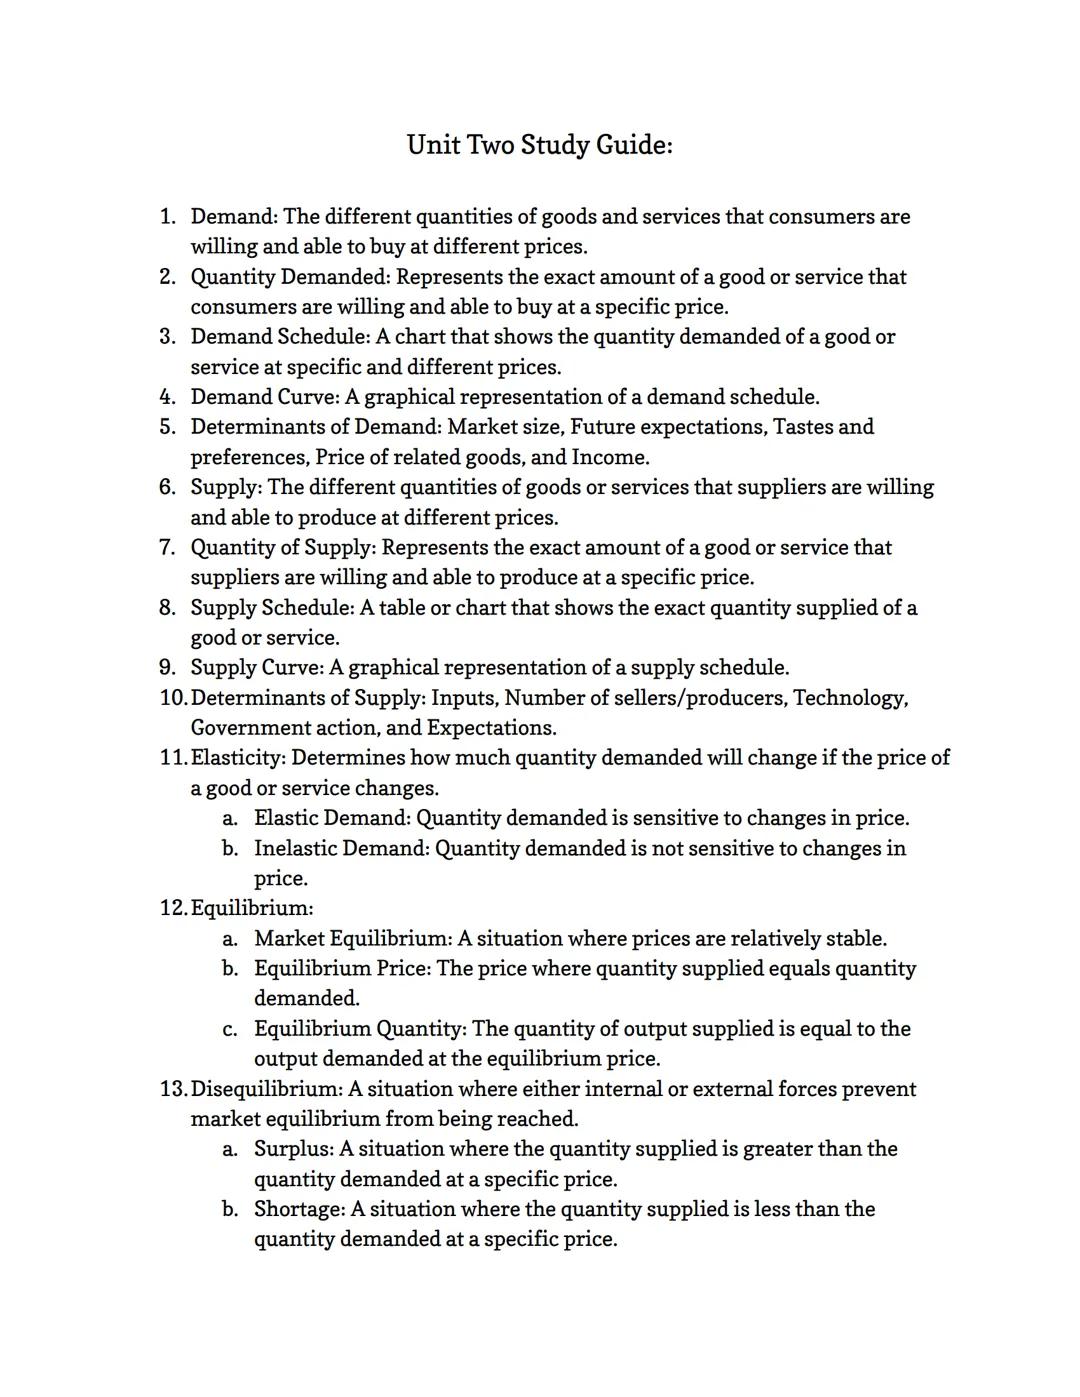
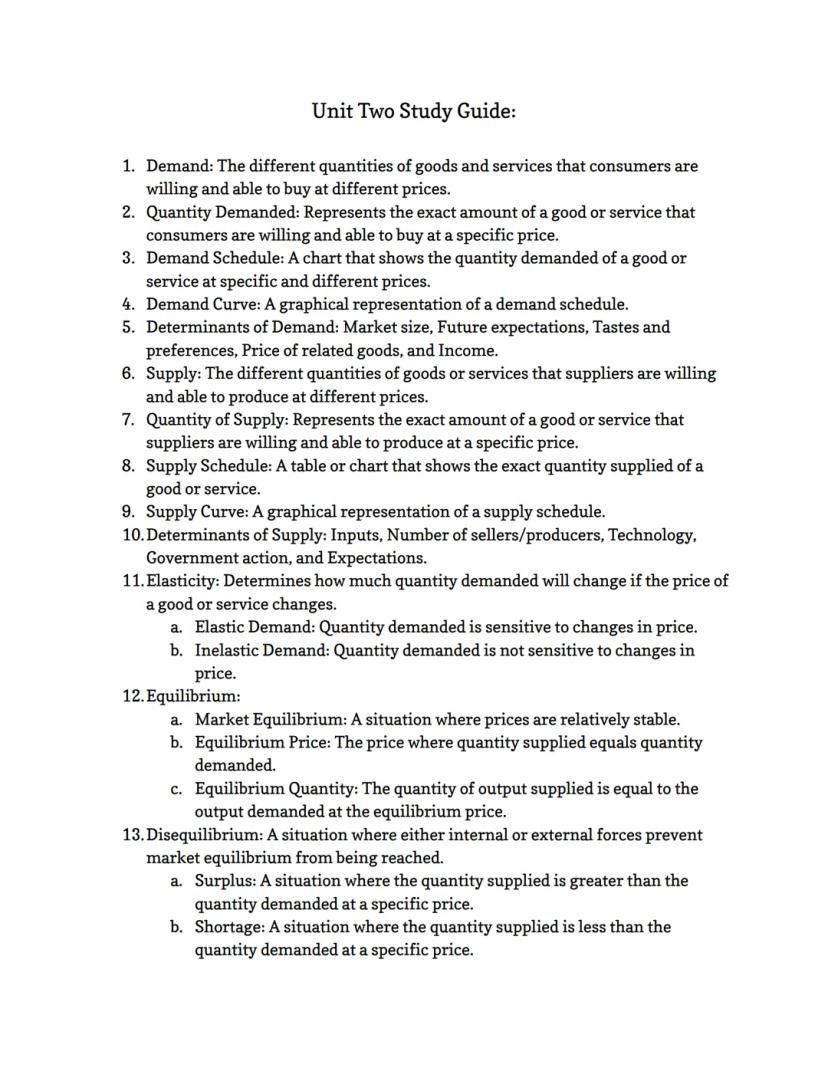
Demand, Supply, and Market Equilibrium
Ever wondered why some products get cheaper when nobody wants them? It all starts with demand - the quantities of goods consumers are willing and able to buy at different prices. When graphed, this creates a demand curve showing how quantity changes with price.
Several factors affect demand beyond just price. These determinants of demand include market size, future expectations, tastes and preferences, prices of related goods, and income levels. Understanding these helps explain why demand changes even when prices don't.
On the flip side, supply represents what producers are willing and able to sell at different prices. The supply curve shows this relationship graphically, while determinants of supply include input costs, number of sellers, technology, government regulations, and producer expectations.
Quick Tip: When studying demand and supply curves, remember they typically move in opposite directions. Demand curves slope downward (lower prices = higher quantity demanded), while supply curves slope upward (higher prices = higher quantity supplied).
When supply meets demand, we reach market equilibrium - the point where quantity supplied equals quantity demanded at the equilibrium price. If prices are too high, a surplus occurs; if too low, a shortage results. These disequilibrium situations naturally push markets back toward equilibrium as prices adjust.
2
of 4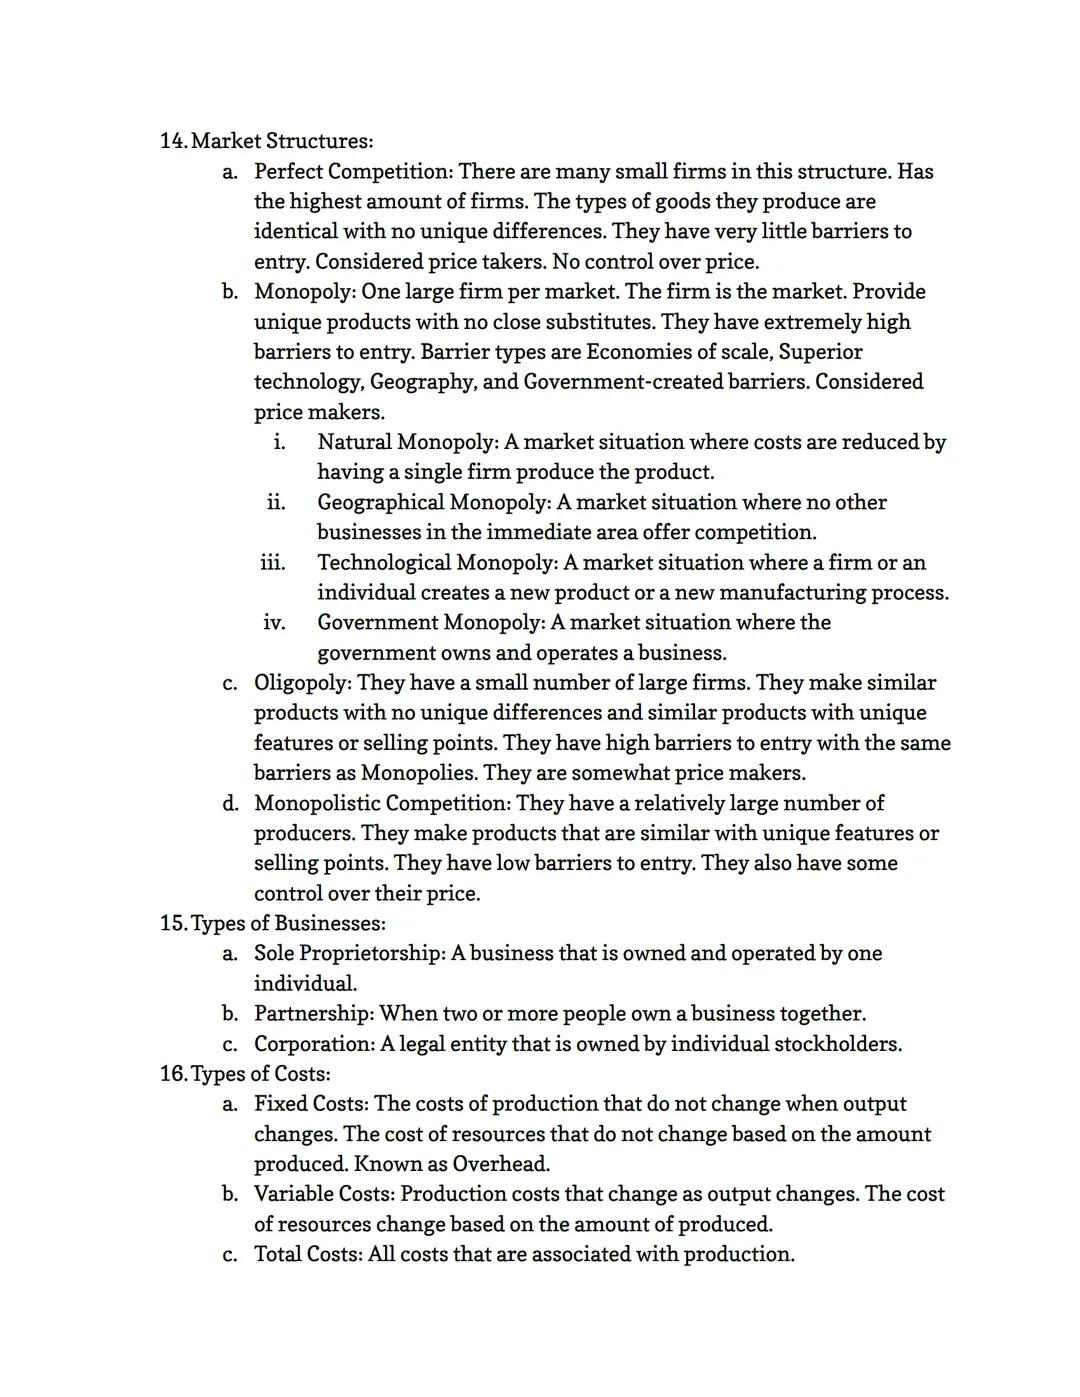
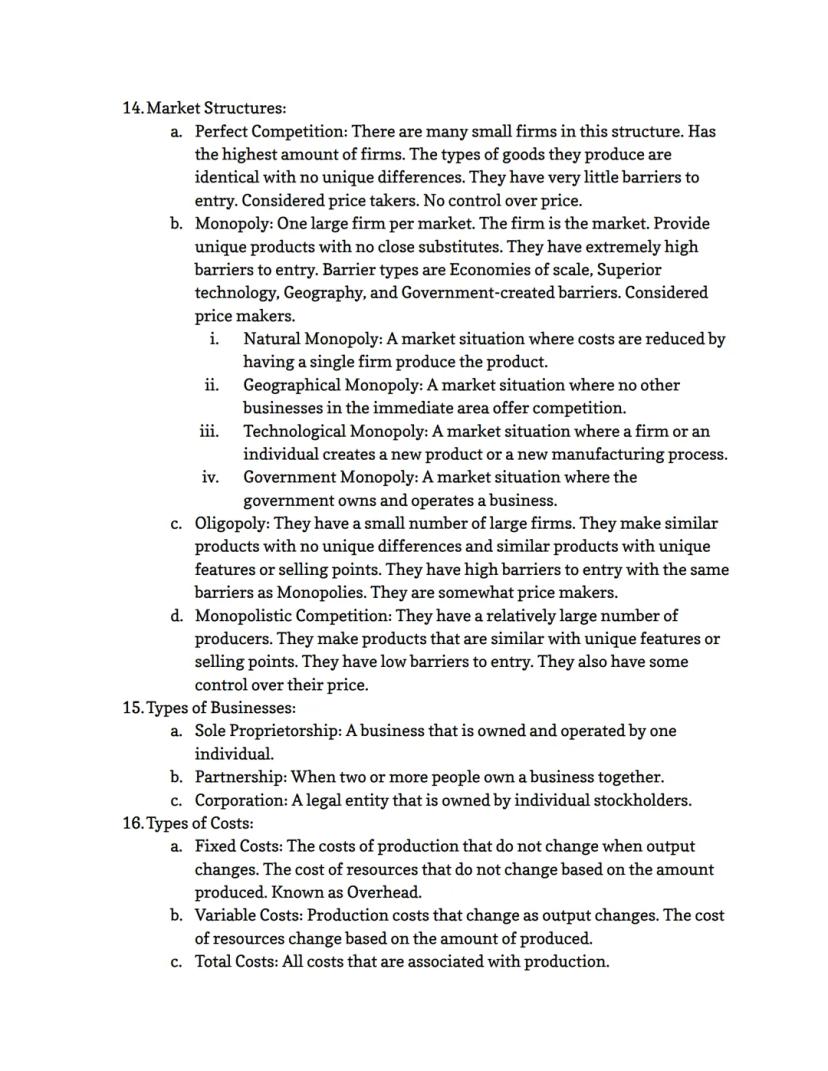
Market Structures and Business Types
The business world isn't one-size-fits-all - it's divided into four main market structures. In perfect competition, many small firms sell identical products with minimal barriers to entry. These firms are price takers with essentially no control over market prices.
At the opposite extreme, a monopoly exists when one large firm dominates an entire market. Monopolies create unique products with no close substitutes and maintain high barriers to entry through economies of scale, superior technology, geographical advantages, or government protection. Unlike competitive firms, monopolies are price makers.
Between these extremes lie two other structures. An oligopoly features a small number of large firms with high barriers to entry, while monopolistic competition includes many producers making similar but differentiated products with low barriers to entry.
Remember This: The key difference between market structures is the degree of competition and price control. As you move from perfect competition toward monopoly, firms gain more control over their prices.
Businesses also take different legal forms. A sole proprietorship has one owner who makes all decisions, while a partnership divides ownership between multiple people. A corporation exists as a legal entity owned by stockholders, offering limited liability but more complex regulations.
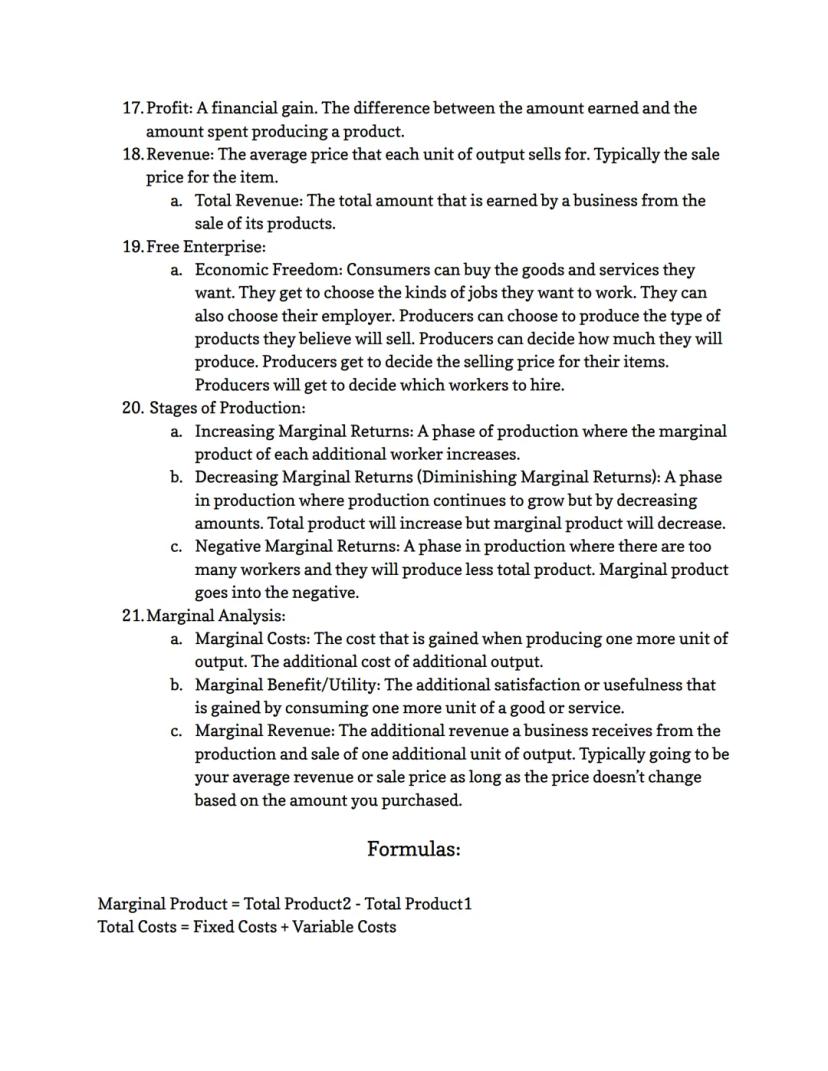
3
of 4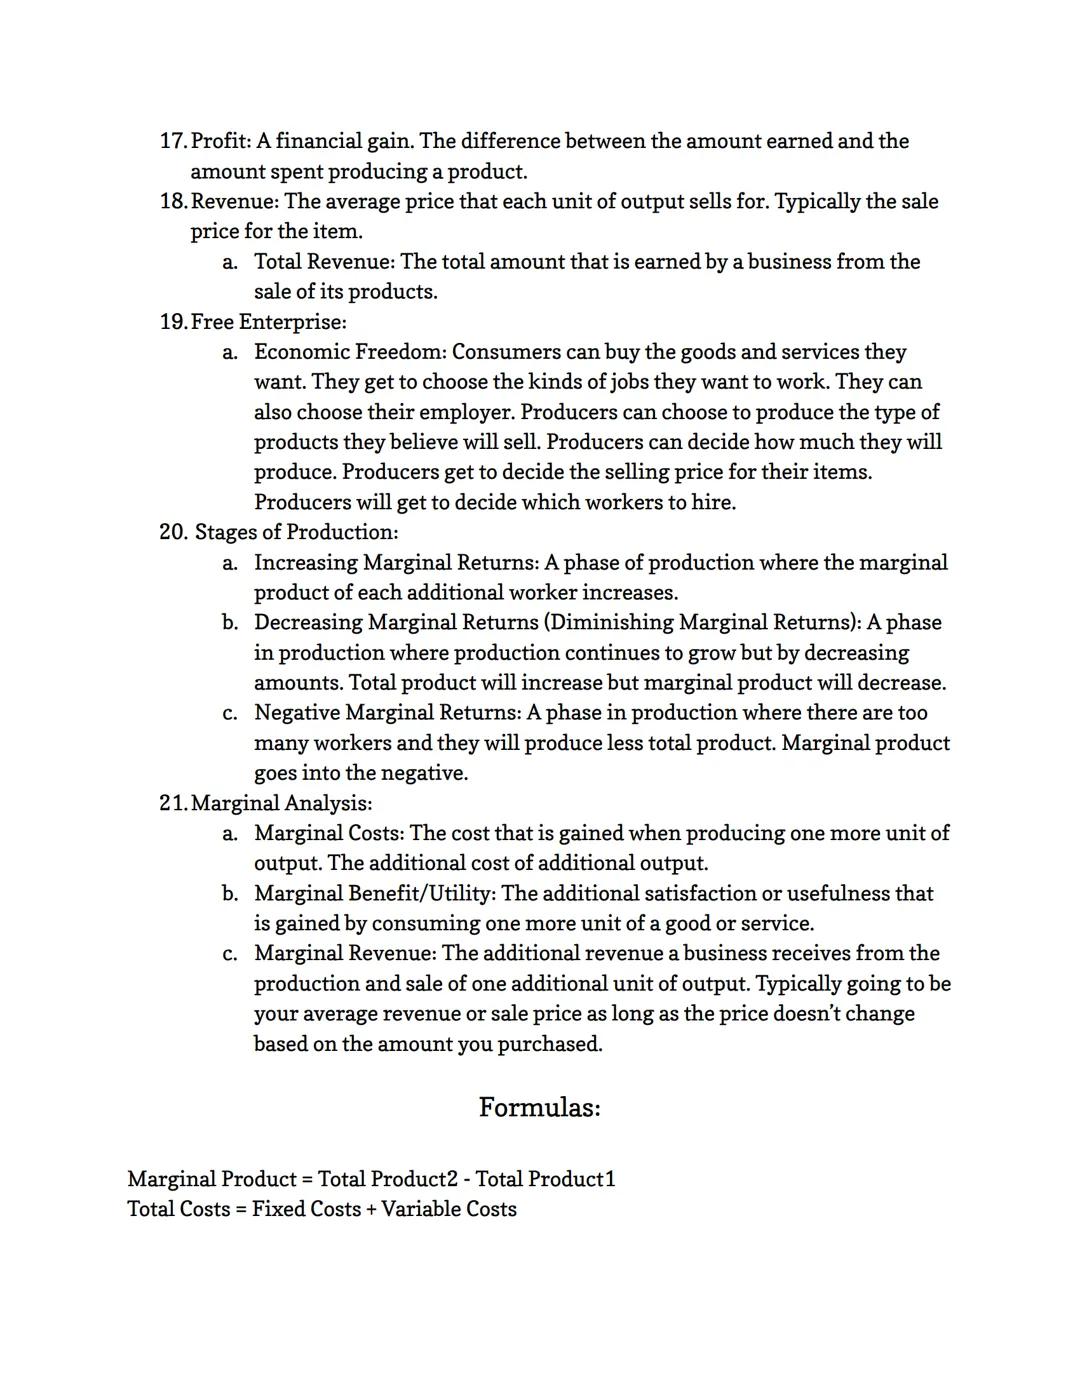
Production Costs, Profit, and Free Enterprise
Making smart business decisions requires understanding costs. Fixed costs (like rent) don't change regardless of how much you produce, while variable costs (like materials) increase with production. Together, they form your total costs of doing business.
Production typically moves through three stages. During increasing marginal returns, each additional worker boosts output significantly. This shifts to decreasing marginal returns where output still grows but more slowly. Eventually, negative marginal returns occur when too many workers actually reduce total output.
The goal of most businesses is to maximize profit - the difference between revenue (money earned from sales) and total costs. Smart businesses use marginal analysis to determine the perfect production level by comparing marginal costs (cost of producing one more unit) with marginal revenue (income from selling one more unit).
Pro Tip: The profit maximization rule is simple but powerful: produce until marginal cost equals marginal revenue (MC = MR). Any more or less production will reduce overall profits.
Our economic system thrives on free enterprise principles. Economic freedom means consumers choose what to buy and where to work, while producers decide what to make, how much to produce, what prices to charge, and whom to hire. These freedoms create the dynamic marketplace we participate in daily.
4
of 4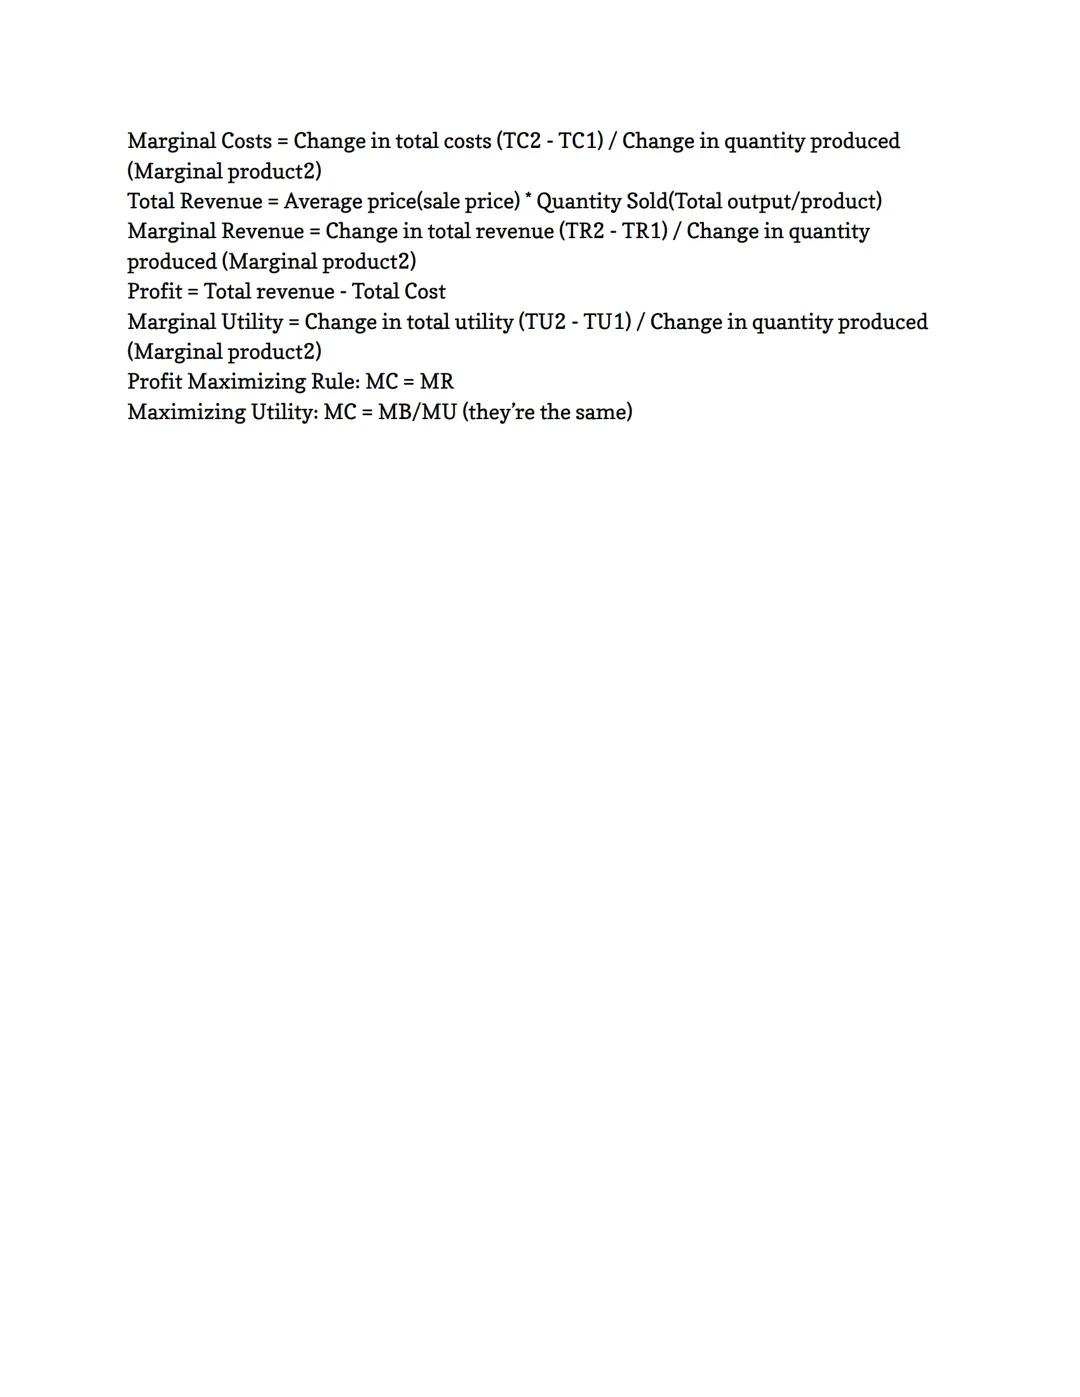
Economic Formulas and Decision Making
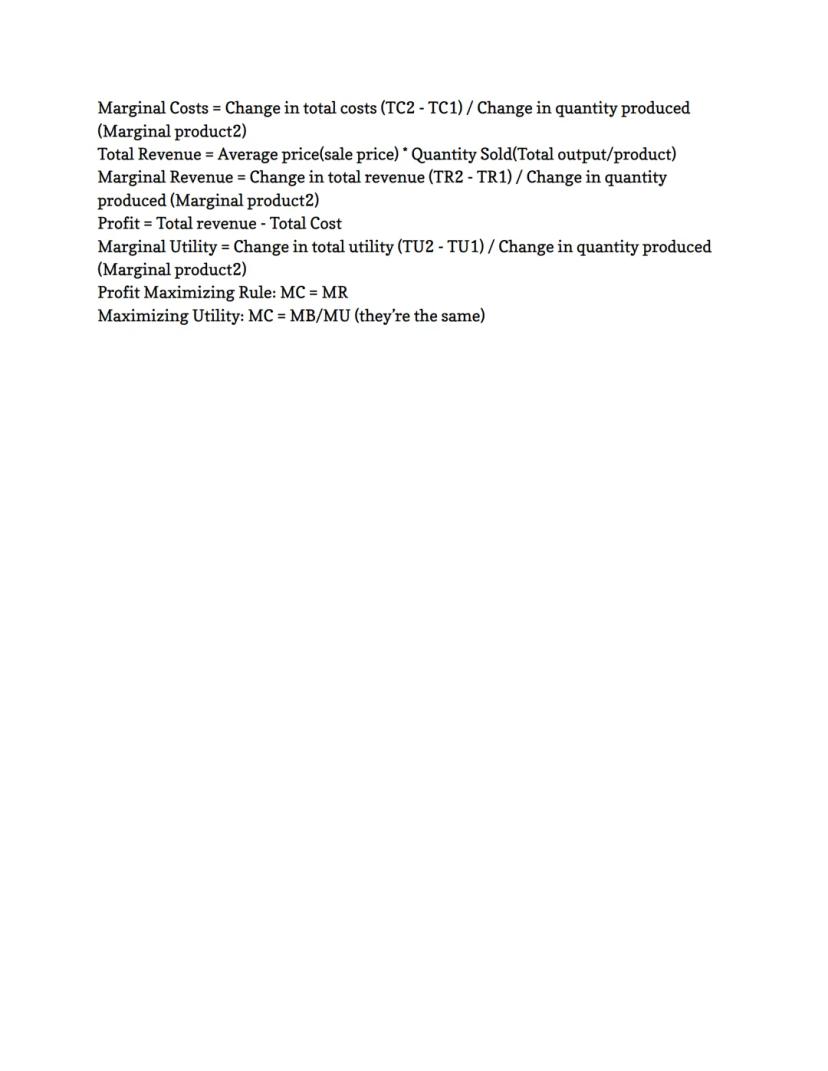
Economics becomes much clearer when you know the math behind it. Key formulas help businesses make smart decisions about production and pricing. For example, calculating marginal product (change in total product) helps track how output changes as you add resources.
Understanding costs is crucial for profitability. The formula Total Costs = Fixed Costs + Variable Costs may seem obvious, but tracking these separately reveals important insights about efficiency. Similarly, Marginal Costs calculations show exactly how much each additional unit costs to produce.
Revenue formulas are equally important. Total Revenue = Average Price × Quantity Sold gives the big picture, while Marginal Revenue calculations show the additional income from selling one more unit. The ultimate goal is maximizing Profit = Total Revenue - Total Cost.
Math Matters: Economic decisions should be data-driven. The profit maximization rule (MC = MR) and the utility maximization rule (MC = MB) are mathematical guides to making optimal choices.
When making personal decisions as a consumer, the concept of marginal utility becomes important. This measures the additional satisfaction gained from consuming one more unit of something. The principle is similar to business decision-making: you should continue consuming until the marginal benefit equals the marginal cost to maximize your overall satisfaction.
We thought you’d never ask...
Our AI companion is specifically built for the needs of students. Based on the millions of content pieces we have on the platform we can provide truly meaningful and relevant answers to students. But its not only about answers, the companion is even more about guiding students through their daily learning challenges, with personalised study plans, quizzes or content pieces in the chat and 100% personalisation based on the students skills and developments.
You can download the app in the Google Play Store and in the Apple App Store.
That's right! Enjoy free access to study content, connect with fellow students, and get instant help – all at your fingertips.
Similar Content
Most popular content in AP Macroeconomics
1Most popular content
9O
Origins and Dynamics of the Columbian Exchange
Analyze the ecological and economic motivations behind the initial transfer of goods, people, and diseases between the Old and New Worlds.
9th3,1280
I
Introduction to Early Cultural Interactions
Analyze the initial social and religious encounters between Europeans, Africans, and Indigenous peoples in the colonial Americas.
9th2,7730
O
Origins of Ancient River Civilizations
Analyze the environmental factors and technological innovations that led to the rise of early states in Mesopotamia, Egypt, and the Indus Valley.
9th3,1870
M
Motivations for European Exploration
Analyze the economic, religious, and political factors that drove European powers to the Americas during the 15th and 16th centuries.
9th1,7780
F
Foundations of Ethical Guidelines in Research
Practice the core principles of the APA ethical code including informed consent, debriefing, and the role of Institutional Review Boards.
9th1,3360
I
Introduction to Native American Societies
Examine the diverse social, political, and economic structures of North American indigenous groups prior to European contact.
9th1,1100
I
Introduction to the Spanish Encomienda System
Explore the fundamental economic and social structures of the Spanish colonial system, focusing on the encomienda and the casta social hierarchy.
9th8890
I
Introduction to Biological Elements of Life
Practice identifying the essential elements including carbon, nitrogen, phosphorus, and sulfur that compose biological macromolecules.
9th1,7410
O
Origins of the Articles of Confederation
Practice identifying the motivations for a weak central government and the specific powers granted to the states under the first U.S. constitution.
9th9370
Students love us — and so will you.
4.6/5App Store
4.7/5Google Play
The app is very easy to use and well designed. I have found everything I was looking for so far and have been able to learn a lot from the presentations! I will definitely use the app for a class assignment! And of course it also helps a lot as an inspiration.
Stefan SiOS user
This app is really great. There are so many study notes and help [...]. My problem subject is French, for example, and the app has so many options for help. Thanks to this app, I have improved my French. I would recommend it to anyone.
Samantha KlichAndroid user
Wow, I am really amazed. I just tried the app because I've seen it advertised many times and was absolutely stunned. This app is THE HELP you want for school and above all, it offers so many things, such as workouts and fact sheets, which have been VERY helpful to me personally.
AnnaiOS user
Comprehensive Unit 2 Microeconomics Definitions Guide
Anna@autumn_anna
Economics may seem complex, but it's really about understanding how people, businesses, and markets interact. This study guide covers essential economic concepts from demand and supply to market structures and business decisions that affect our everyday lives and shape the...
1
of 4
Sign up to see the content. It's free!
- Access to all documents
- Improve your grades
- Join milions of students
Demand, Supply, and Market Equilibrium
Ever wondered why some products get cheaper when nobody wants them? It all starts with demand - the quantities of goods consumers are willing and able to buy at different prices. When graphed, this creates a demand curve showing how quantity changes with price.
Several factors affect demand beyond just price. These determinants of demand include market size, future expectations, tastes and preferences, prices of related goods, and income levels. Understanding these helps explain why demand changes even when prices don't.
On the flip side, supply represents what producers are willing and able to sell at different prices. The supply curve shows this relationship graphically, while determinants of supply include input costs, number of sellers, technology, government regulations, and producer expectations.
Quick Tip: When studying demand and supply curves, remember they typically move in opposite directions. Demand curves slope downward (lower prices = higher quantity demanded), while supply curves slope upward (higher prices = higher quantity supplied).
When supply meets demand, we reach market equilibrium - the point where quantity supplied equals quantity demanded at the equilibrium price. If prices are too high, a surplus occurs; if too low, a shortage results. These disequilibrium situations naturally push markets back toward equilibrium as prices adjust.
2
of 4Sign up to see the content. It's free!
- Access to all documents
- Improve your grades
- Join milions of students
Market Structures and Business Types
The business world isn't one-size-fits-all - it's divided into four main market structures. In perfect competition, many small firms sell identical products with minimal barriers to entry. These firms are price takers with essentially no control over market prices.
At the opposite extreme, a monopoly exists when one large firm dominates an entire market. Monopolies create unique products with no close substitutes and maintain high barriers to entry through economies of scale, superior technology, geographical advantages, or government protection. Unlike competitive firms, monopolies are price makers.
Between these extremes lie two other structures. An oligopoly features a small number of large firms with high barriers to entry, while monopolistic competition includes many producers making similar but differentiated products with low barriers to entry.
Remember This: The key difference between market structures is the degree of competition and price control. As you move from perfect competition toward monopoly, firms gain more control over their prices.
Businesses also take different legal forms. A sole proprietorship has one owner who makes all decisions, while a partnership divides ownership between multiple people. A corporation exists as a legal entity owned by stockholders, offering limited liability but more complex regulations.
3
of 4Sign up to see the content. It's free!
- Access to all documents
- Improve your grades
- Join milions of students
Production Costs, Profit, and Free Enterprise
Making smart business decisions requires understanding costs. Fixed costs (like rent) don't change regardless of how much you produce, while variable costs (like materials) increase with production. Together, they form your total costs of doing business.
Production typically moves through three stages. During increasing marginal returns, each additional worker boosts output significantly. This shifts to decreasing marginal returns where output still grows but more slowly. Eventually, negative marginal returns occur when too many workers actually reduce total output.
The goal of most businesses is to maximize profit - the difference between revenue (money earned from sales) and total costs. Smart businesses use marginal analysis to determine the perfect production level by comparing marginal costs (cost of producing one more unit) with marginal revenue (income from selling one more unit).
Pro Tip: The profit maximization rule is simple but powerful: produce until marginal cost equals marginal revenue (MC = MR). Any more or less production will reduce overall profits.
Our economic system thrives on free enterprise principles. Economic freedom means consumers choose what to buy and where to work, while producers decide what to make, how much to produce, what prices to charge, and whom to hire. These freedoms create the dynamic marketplace we participate in daily.
4
of 4Sign up to see the content. It's free!
- Access to all documents
- Improve your grades
- Join milions of students
Economic Formulas and Decision Making
Economics becomes much clearer when you know the math behind it. Key formulas help businesses make smart decisions about production and pricing. For example, calculating marginal product (change in total product) helps track how output changes as you add resources.
Understanding costs is crucial for profitability. The formula Total Costs = Fixed Costs + Variable Costs may seem obvious, but tracking these separately reveals important insights about efficiency. Similarly, Marginal Costs calculations show exactly how much each additional unit costs to produce.
Revenue formulas are equally important. Total Revenue = Average Price × Quantity Sold gives the big picture, while Marginal Revenue calculations show the additional income from selling one more unit. The ultimate goal is maximizing Profit = Total Revenue - Total Cost.
Math Matters: Economic decisions should be data-driven. The profit maximization rule (MC = MR) and the utility maximization rule (MC = MB) are mathematical guides to making optimal choices.
When making personal decisions as a consumer, the concept of marginal utility becomes important. This measures the additional satisfaction gained from consuming one more unit of something. The principle is similar to business decision-making: you should continue consuming until the marginal benefit equals the marginal cost to maximize your overall satisfaction.
We thought you’d never ask...
Our AI companion is specifically built for the needs of students. Based on the millions of content pieces we have on the platform we can provide truly meaningful and relevant answers to students. But its not only about answers, the companion is even more about guiding students through their daily learning challenges, with personalised study plans, quizzes or content pieces in the chat and 100% personalisation based on the students skills and developments.
You can download the app in the Google Play Store and in the Apple App Store.
That's right! Enjoy free access to study content, connect with fellow students, and get instant help – all at your fingertips.
Similar Content
Most popular content in AP Macroeconomics
1Most popular content
9O
Origins and Dynamics of the Columbian Exchange
Analyze the ecological and economic motivations behind the initial transfer of goods, people, and diseases between the Old and New Worlds.
9th3,1280
I
Introduction to Early Cultural Interactions
Analyze the initial social and religious encounters between Europeans, Africans, and Indigenous peoples in the colonial Americas.
9th2,7730
O
Origins of Ancient River Civilizations
Analyze the environmental factors and technological innovations that led to the rise of early states in Mesopotamia, Egypt, and the Indus Valley.
9th3,1870
M
Motivations for European Exploration
Analyze the economic, religious, and political factors that drove European powers to the Americas during the 15th and 16th centuries.
9th1,7780
F
Foundations of Ethical Guidelines in Research
Practice the core principles of the APA ethical code including informed consent, debriefing, and the role of Institutional Review Boards.
9th1,3360
I
Introduction to Native American Societies
Examine the diverse social, political, and economic structures of North American indigenous groups prior to European contact.
9th1,1100
I
Introduction to the Spanish Encomienda System
Explore the fundamental economic and social structures of the Spanish colonial system, focusing on the encomienda and the casta social hierarchy.
9th8890
I
Introduction to Biological Elements of Life
Practice identifying the essential elements including carbon, nitrogen, phosphorus, and sulfur that compose biological macromolecules.
9th1,7410
O
Origins of the Articles of Confederation
Practice identifying the motivations for a weak central government and the specific powers granted to the states under the first U.S. constitution.
9th9370
Students love us — and so will you.
4.6/5App Store
4.7/5Google Play
The app is very easy to use and well designed. I have found everything I was looking for so far and have been able to learn a lot from the presentations! I will definitely use the app for a class assignment! And of course it also helps a lot as an inspiration.
Stefan SiOS user
This app is really great. There are so many study notes and help [...]. My problem subject is French, for example, and the app has so many options for help. Thanks to this app, I have improved my French. I would recommend it to anyone.
Samantha KlichAndroid user
Wow, I am really amazed. I just tried the app because I've seen it advertised many times and was absolutely stunned. This app is THE HELP you want for school and above all, it offers so many things, such as workouts and fact sheets, which have been VERY helpful to me personally.
AnnaiOS user