Get ready to master key calculus concepts with these notes...
Quick AP Precalculus Unit 1 Notes with Key Abbreviations
S
shri@shri_ftwxijgaoqoiaqf


1 / 3
1
of 3
Rate of Change and Function Behavior
The rate of change (ROC) tells us how quickly a function's output changes compared to its input. We calculate it using the formula: ROC = /. This is essentially the slope of a line between two points.
Different functions have different ROC patterns. For linear functions, ROC is constant. For quadratic functions, ROC changes linearly. Understanding these patterns helps you identify function types from data.
When analyzing graphs, remember that positive ROC means the function is increasing, while negative ROC means it's decreasing. The concavity matters too—concave up shows an increasing rate of change, while concave down shows a decreasing rate.
Quick Tip: To find a polynomial's degree from a table of values, count how many times you need to take differences until you get a constant value. For example, if you need to take differences twice, it's a quadratic (degree 2).
Polynomials have special properties worth noting. The degree tells you the maximum number of zeros (x-intercepts) possible. Even multiplicity zeros create tangent points with the x-axis, while odd multiplicity zeros cross through the axis.
2
of 3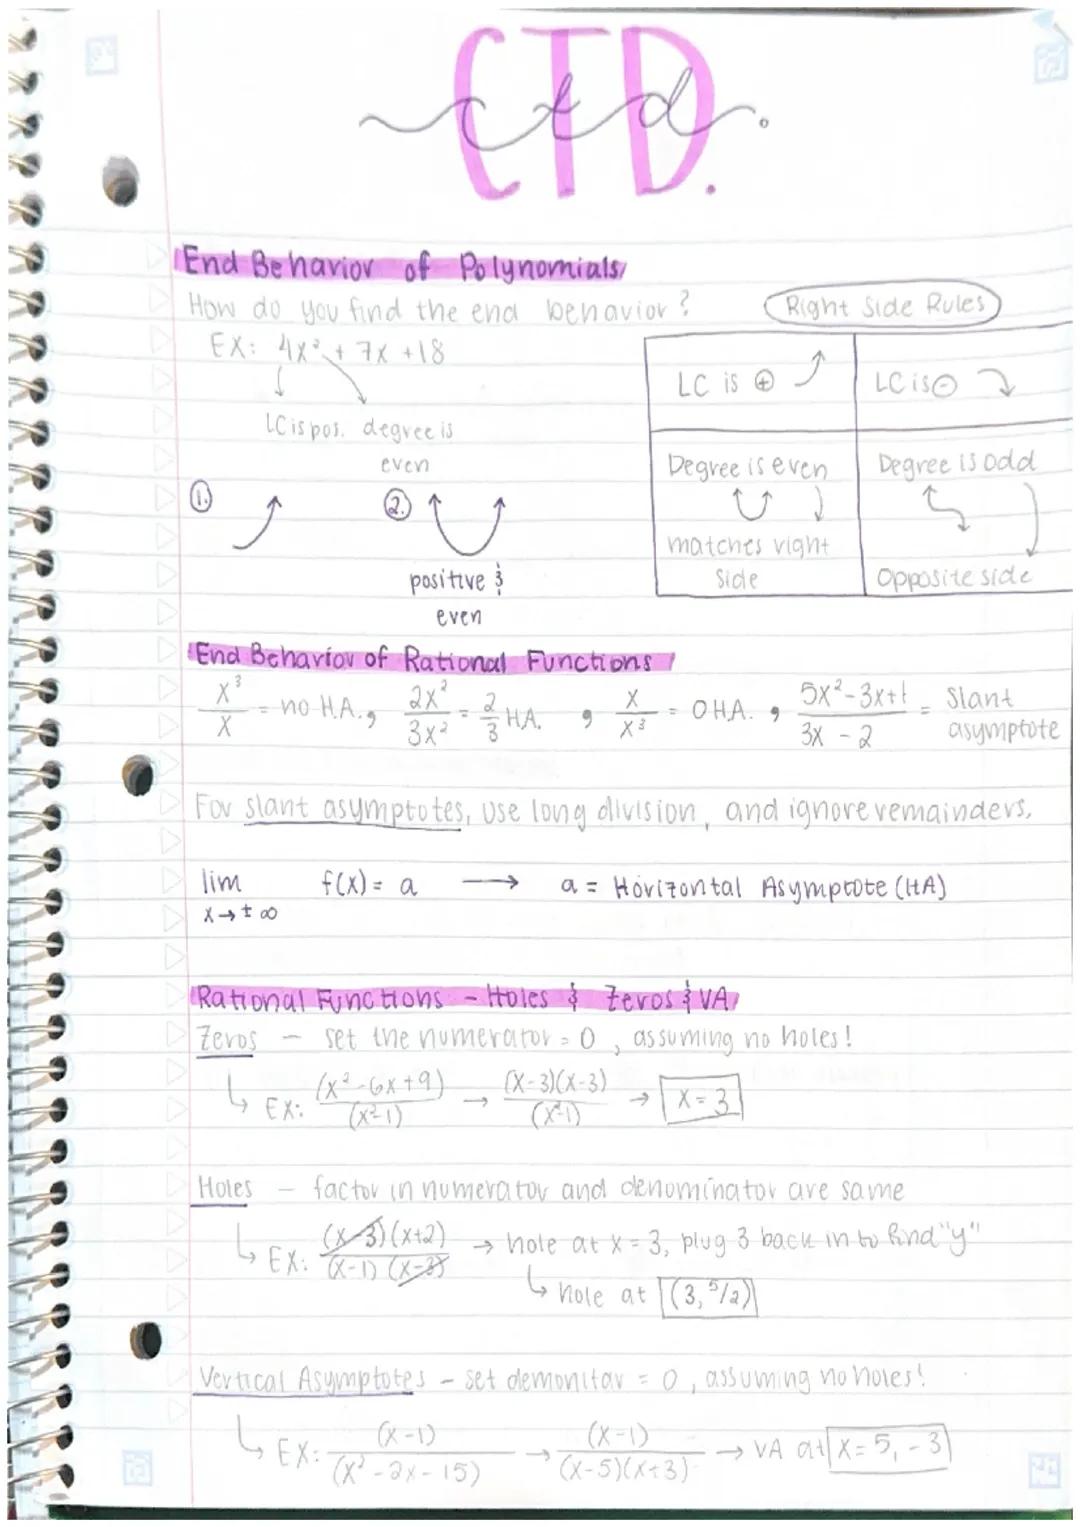
Polynomial and Rational Function Behavior
The end behavior of polynomials depends on the leading coefficient (LC) and the degree. For even-degree polynomials with positive LC, both ends point upward. Odd-degree polynomials with positive LC have one end up and one down.
Rational functions have special features called asymptotes. When the numerator's degree is less than the denominator's, you get horizontal asymptotes (HA). Equal degrees give you a horizontal asymptote at the ratio of leading coefficients. When the numerator's degree exceeds the denominator's by exactly 1, you get a slant asymptote.
Finding zeros of rational functions means setting the numerator to zero (assuming no holes). Holes occur when the same factor appears in both numerator and denominator. To find a hole, remove the common factor, then calculate the y-value at that point.
Remember: Vertical asymptotes (VA) occur where the denominator equals zero (without being canceled by the numerator). These are places where the function shoots toward infinity!
To find slant asymptotes, use polynomial long division and ignore the remainder term. This gives you the equation of the line the function approaches as x gets very large or very small.
3
of 3
Limits and Function Transformations
When working with rational functions, holes represent points where the function isn't defined, but the limit exists. We can approach these points from either direction:
- Left-hand limit: lim(x→a⁻) f
- Right-hand limit: lim(x→a⁺) f
For a hole, these limits are equal, though the function itself is undefined at that point.
Function transformations follow a specific pattern in y = af+d:
- a: Vertical dilation (stretches or compresses the y-values)
- b: Horizontal dilation by a factor of 1/b (affects x-values)
- c: Horizontal translation (shifts left or right)
- d: Vertical translation (shifts up or down)
Pro Tip: When transforming functions, work from inside to outside: first handle the horizontal shift , then horizontal dilation , followed by vertical dilation , and finally vertical shift .
These transformations let you create complex function shapes from simpler ones. Master them, and you'll be able to sketch almost any function quickly!
We thought you’d never ask...
Our AI companion is specifically built for the needs of students. Based on the millions of content pieces we have on the platform we can provide truly meaningful and relevant answers to students. But its not only about answers, the companion is even more about guiding students through their daily learning challenges, with personalised study plans, quizzes or content pieces in the chat and 100% personalisation based on the students skills and developments.
You can download the app in the Google Play Store and in the Apple App Store.
That's right! Enjoy free access to study content, connect with fellow students, and get instant help – all at your fingertips.
Similar Content
Most popular content in Pre-Calculus
9Solutions of Oblique Triangles
This is a note about solutions of oblique triangles with examples.
762
Mathematics (Solid Mensuration)
This note is all about solid mensuration, angles, and polygons. It includes formulas and sample problems with solution.
3113
Derivation
Calculus
964
The remainder theorem and factor theorem
Notes about the topic
591
Trigonometry (Polygons)
This note is all about trigonometry, discussing the concept of polygons and how to solve problems involving polygons. It also includes formulas and sample problems.
660
Introduction to Limits and Limit Techniques
Gives an introduction to Limits and Limit techniques through graphs, explanations, and example work.
10th551
Solid Mensuration
Basic concepts on solid mensuration
681
Pythagorean Theorem
Precalculus Graphing basics, Distance Formula, Midpoint Formula
391
Derivative of Trigonometric Functions
This is about getting the derivative of trigonometric functions.
241
Most popular content
9O
Origins and Dynamics of the Columbian Exchange
Analyze the ecological and economic motivations behind the initial transfer of goods, people, and diseases between the Old and New Worlds.
9th3,1280
I
Introduction to Early Cultural Interactions
Analyze the initial social and religious encounters between Europeans, Africans, and Indigenous peoples in the colonial Americas.
9th2,7730
O
Origins of Ancient River Civilizations
Analyze the environmental factors and technological innovations that led to the rise of early states in Mesopotamia, Egypt, and the Indus Valley.
9th3,1870
M
Motivations for European Exploration
Analyze the economic, religious, and political factors that drove European powers to the Americas during the 15th and 16th centuries.
9th1,7780
F
Foundations of Ethical Guidelines in Research
Practice the core principles of the APA ethical code including informed consent, debriefing, and the role of Institutional Review Boards.
9th1,3360
I
Introduction to Native American Societies
Examine the diverse social, political, and economic structures of North American indigenous groups prior to European contact.
9th1,1100
I
Introduction to the Spanish Encomienda System
Explore the fundamental economic and social structures of the Spanish colonial system, focusing on the encomienda and the casta social hierarchy.
9th8890
I
Introduction to Biological Elements of Life
Practice identifying the essential elements including carbon, nitrogen, phosphorus, and sulfur that compose biological macromolecules.
9th1,7410
O
Origins of the Articles of Confederation
Practice identifying the motivations for a weak central government and the specific powers granted to the states under the first U.S. constitution.
9th9370
Students love us — and so will you.
4.6/5App Store
4.7/5Google Play
The app is very easy to use and well designed. I have found everything I was looking for so far and have been able to learn a lot from the presentations! I will definitely use the app for a class assignment! And of course it also helps a lot as an inspiration.
Stefan SiOS user
This app is really great. There are so many study notes and help [...]. My problem subject is French, for example, and the app has so many options for help. Thanks to this app, I have improved my French. I would recommend it to anyone.
Samantha KlichAndroid user
Wow, I am really amazed. I just tried the app because I've seen it advertised many times and was absolutely stunned. This app is THE HELP you want for school and above all, it offers so many things, such as workouts and fact sheets, which have been VERY helpful to me personally.
AnnaiOS user
Quick AP Precalculus Unit 1 Notes with Key Abbreviations
S
shri@shri_ftwxijgaoqoiaqf
Get ready to master key calculus concepts with these notes on rate of change, polynomials, rational functions, and transformations. These fundamental principles will help you analyze functions, understand their behavior, and predict their graphs.
1
of 3
Sign up to see the content. It's free!
- Access to all documents
- Improve your grades
- Join milions of students
Rate of Change and Function Behavior
The rate of change (ROC) tells us how quickly a function's output changes compared to its input. We calculate it using the formula: ROC = /. This is essentially the slope of a line between two points.
Different functions have different ROC patterns. For linear functions, ROC is constant. For quadratic functions, ROC changes linearly. Understanding these patterns helps you identify function types from data.
When analyzing graphs, remember that positive ROC means the function is increasing, while negative ROC means it's decreasing. The concavity matters too—concave up shows an increasing rate of change, while concave down shows a decreasing rate.
Quick Tip: To find a polynomial's degree from a table of values, count how many times you need to take differences until you get a constant value. For example, if you need to take differences twice, it's a quadratic (degree 2).
Polynomials have special properties worth noting. The degree tells you the maximum number of zeros (x-intercepts) possible. Even multiplicity zeros create tangent points with the x-axis, while odd multiplicity zeros cross through the axis.
2
of 3Sign up to see the content. It's free!
- Access to all documents
- Improve your grades
- Join milions of students
Polynomial and Rational Function Behavior
The end behavior of polynomials depends on the leading coefficient (LC) and the degree. For even-degree polynomials with positive LC, both ends point upward. Odd-degree polynomials with positive LC have one end up and one down.
Rational functions have special features called asymptotes. When the numerator's degree is less than the denominator's, you get horizontal asymptotes (HA). Equal degrees give you a horizontal asymptote at the ratio of leading coefficients. When the numerator's degree exceeds the denominator's by exactly 1, you get a slant asymptote.
Finding zeros of rational functions means setting the numerator to zero (assuming no holes). Holes occur when the same factor appears in both numerator and denominator. To find a hole, remove the common factor, then calculate the y-value at that point.
Remember: Vertical asymptotes (VA) occur where the denominator equals zero (without being canceled by the numerator). These are places where the function shoots toward infinity!
To find slant asymptotes, use polynomial long division and ignore the remainder term. This gives you the equation of the line the function approaches as x gets very large or very small.
3
of 3Sign up to see the content. It's free!
- Access to all documents
- Improve your grades
- Join milions of students
Limits and Function Transformations
When working with rational functions, holes represent points where the function isn't defined, but the limit exists. We can approach these points from either direction:
- Left-hand limit: lim(x→a⁻) f
- Right-hand limit: lim(x→a⁺) f
For a hole, these limits are equal, though the function itself is undefined at that point.
Function transformations follow a specific pattern in y = af+d:
- a: Vertical dilation (stretches or compresses the y-values)
- b: Horizontal dilation by a factor of 1/b (affects x-values)
- c: Horizontal translation (shifts left or right)
- d: Vertical translation (shifts up or down)
Pro Tip: When transforming functions, work from inside to outside: first handle the horizontal shift , then horizontal dilation , followed by vertical dilation , and finally vertical shift .
These transformations let you create complex function shapes from simpler ones. Master them, and you'll be able to sketch almost any function quickly!
We thought you’d never ask...
Our AI companion is specifically built for the needs of students. Based on the millions of content pieces we have on the platform we can provide truly meaningful and relevant answers to students. But its not only about answers, the companion is even more about guiding students through their daily learning challenges, with personalised study plans, quizzes or content pieces in the chat and 100% personalisation based on the students skills and developments.
You can download the app in the Google Play Store and in the Apple App Store.
That's right! Enjoy free access to study content, connect with fellow students, and get instant help – all at your fingertips.
Similar Content
Most popular content in Pre-Calculus
9Solutions of Oblique Triangles
This is a note about solutions of oblique triangles with examples.
762
Mathematics (Solid Mensuration)
This note is all about solid mensuration, angles, and polygons. It includes formulas and sample problems with solution.
3113
Derivation
Calculus
964
The remainder theorem and factor theorem
Notes about the topic
591
Trigonometry (Polygons)
This note is all about trigonometry, discussing the concept of polygons and how to solve problems involving polygons. It also includes formulas and sample problems.
660
Introduction to Limits and Limit Techniques
Gives an introduction to Limits and Limit techniques through graphs, explanations, and example work.
10th551
Solid Mensuration
Basic concepts on solid mensuration
681
Pythagorean Theorem
Precalculus Graphing basics, Distance Formula, Midpoint Formula
391
Derivative of Trigonometric Functions
This is about getting the derivative of trigonometric functions.
241
Most popular content
9O
Origins and Dynamics of the Columbian Exchange
Analyze the ecological and economic motivations behind the initial transfer of goods, people, and diseases between the Old and New Worlds.
9th3,1280
I
Introduction to Early Cultural Interactions
Analyze the initial social and religious encounters between Europeans, Africans, and Indigenous peoples in the colonial Americas.
9th2,7730
O
Origins of Ancient River Civilizations
Analyze the environmental factors and technological innovations that led to the rise of early states in Mesopotamia, Egypt, and the Indus Valley.
9th3,1870
M
Motivations for European Exploration
Analyze the economic, religious, and political factors that drove European powers to the Americas during the 15th and 16th centuries.
9th1,7780
F
Foundations of Ethical Guidelines in Research
Practice the core principles of the APA ethical code including informed consent, debriefing, and the role of Institutional Review Boards.
9th1,3360
I
Introduction to Native American Societies
Examine the diverse social, political, and economic structures of North American indigenous groups prior to European contact.
9th1,1100
I
Introduction to the Spanish Encomienda System
Explore the fundamental economic and social structures of the Spanish colonial system, focusing on the encomienda and the casta social hierarchy.
9th8890
I
Introduction to Biological Elements of Life
Practice identifying the essential elements including carbon, nitrogen, phosphorus, and sulfur that compose biological macromolecules.
9th1,7410
O
Origins of the Articles of Confederation
Practice identifying the motivations for a weak central government and the specific powers granted to the states under the first U.S. constitution.
9th9370
Students love us — and so will you.
4.6/5App Store
4.7/5Google Play
The app is very easy to use and well designed. I have found everything I was looking for so far and have been able to learn a lot from the presentations! I will definitely use the app for a class assignment! And of course it also helps a lot as an inspiration.
Stefan SiOS user
This app is really great. There are so many study notes and help [...]. My problem subject is French, for example, and the app has so many options for help. Thanks to this app, I have improved my French. I would recommend it to anyone.
Samantha KlichAndroid user
Wow, I am really amazed. I just tried the app because I've seen it advertised many times and was absolutely stunned. This app is THE HELP you want for school and above all, it offers so many things, such as workouts and fact sheets, which have been VERY helpful to me personally.
AnnaiOS user