Conics are fascinating geometric shapes formed when a plane intersects...
Understanding Parabolas in Conic Sections


1 / 4
1
of 4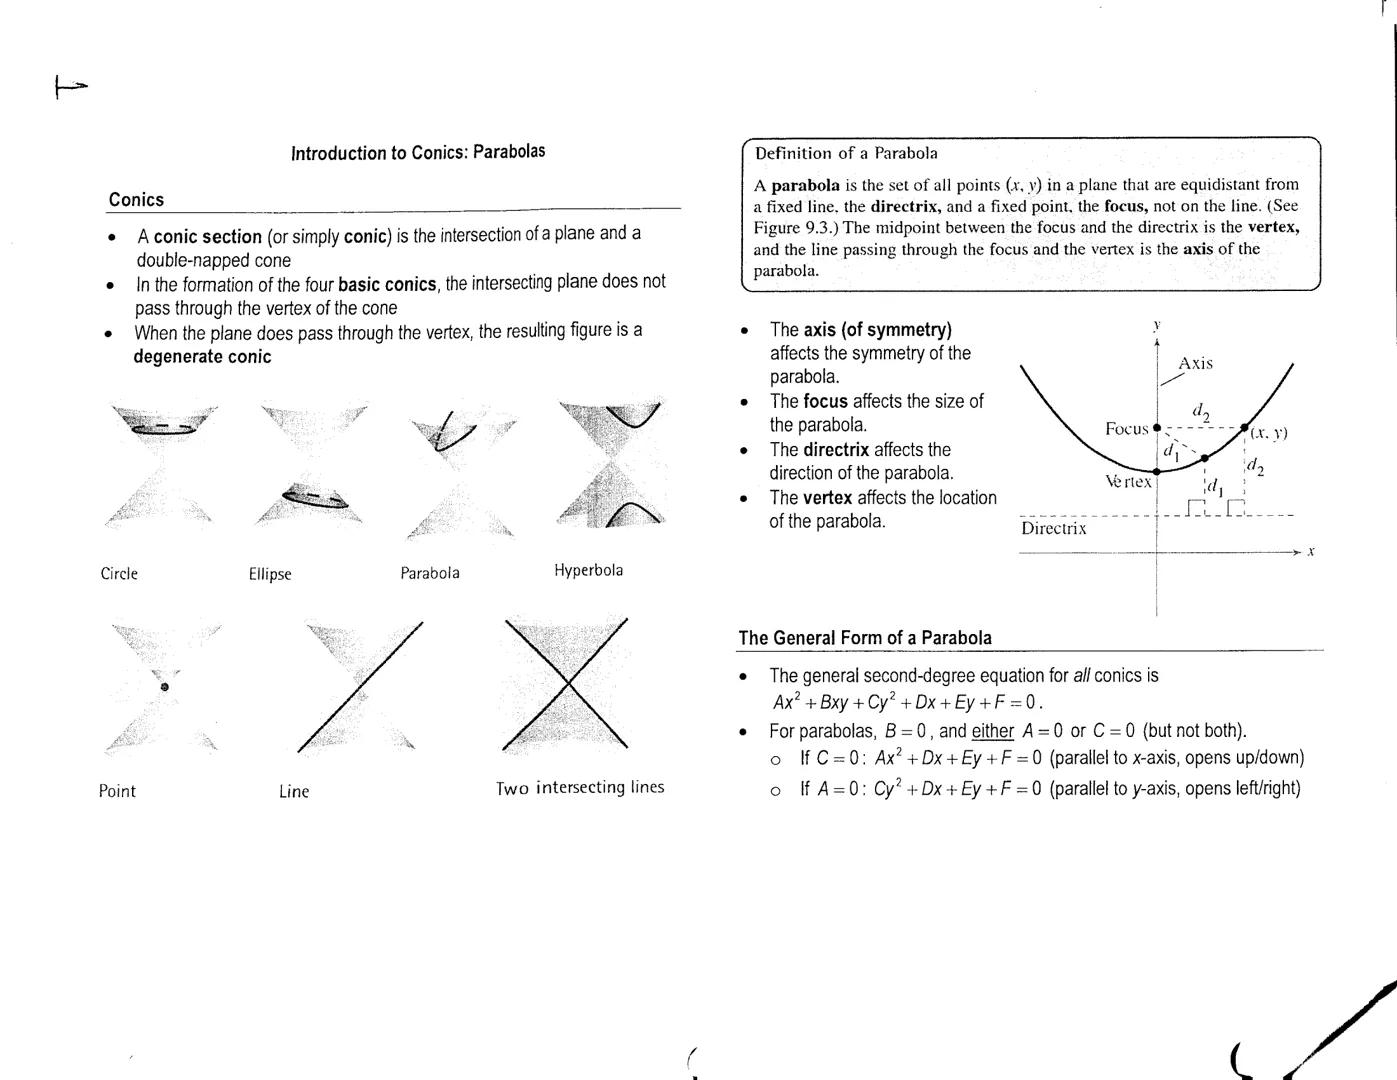
Introduction to Parabolas
A parabola is a set of points that are equidistant from a fixed point (the focus) and a fixed line (the directrix). The vertex sits halfway between the focus and directrix, while the axis runs through both the focus and vertex.
Several key elements determine a parabola's appearance. The axis affects its symmetry, the focus determines its size, the directrix influences its direction, and the vertex establishes its location. When you see a parabola in standard form, you can immediately tell which way it opens and where it's positioned.
The general form of a parabola comes from the conic section equation: Ax² + Bxy + Cy² + Dx + Ey + F = 0. For parabolas specifically, B = 0, and either A = 0 or C = 0 (but not both). This gives us two possible forms:
- If C = 0: Ax² + Dx + Ey + F = 0 (opens up/down)
- If A = 0: Cy² + Dx + Ey + F = 0 (opens left/right)
Try This! Next time you see a satellite dish or the path of a ball tossed in the air, you're looking at a parabola in real life! The shape's special reflective properties make it perfect for focusing signals or following physical laws.
2
of 4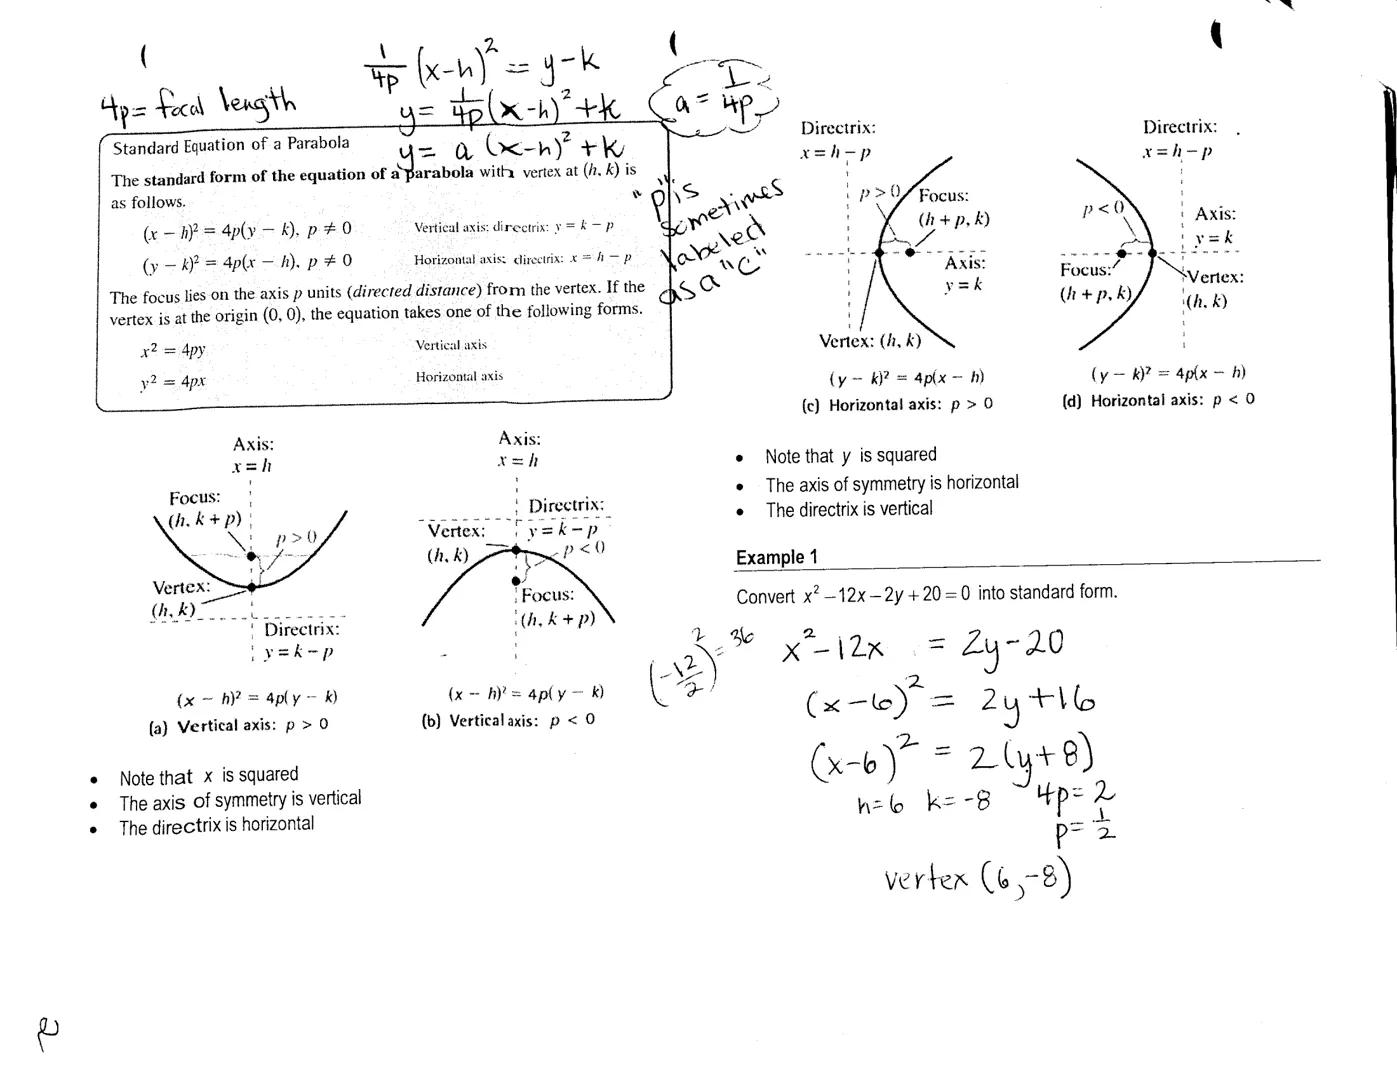
Standard Equations of Parabolas
The standard form of a parabola with vertex at (h,k) comes in two main types, depending on which way it opens:
- ² = 4p for vertical parabolas
- ² = 4p for horizontal parabolas
The value of p is crucial - it represents the directed distance from the vertex to the focus. When p is positive, the parabola opens upward or to the right. When p is negative, it opens downward or to the left.
For vertical parabolas, the axis of symmetry is vertical , and the directrix is horizontal . For horizontal parabolas, the axis is horizontal , and the directrix is vertical . These relationships help you quickly visualize the parabola's orientation.
Let's look at an example: To convert x²-12x-2y+20=0 into standard form, we complete the square:
- x²-12x = 2y-20
- ² = 2y+16
- ² = 2 This gives us vertex with p=½, meaning it opens upward.
Remember: The variable that's squared tells you the orientation of the parabola. If x is squared, the parabola opens up/down; if y is squared, it opens left/right.
3
of 4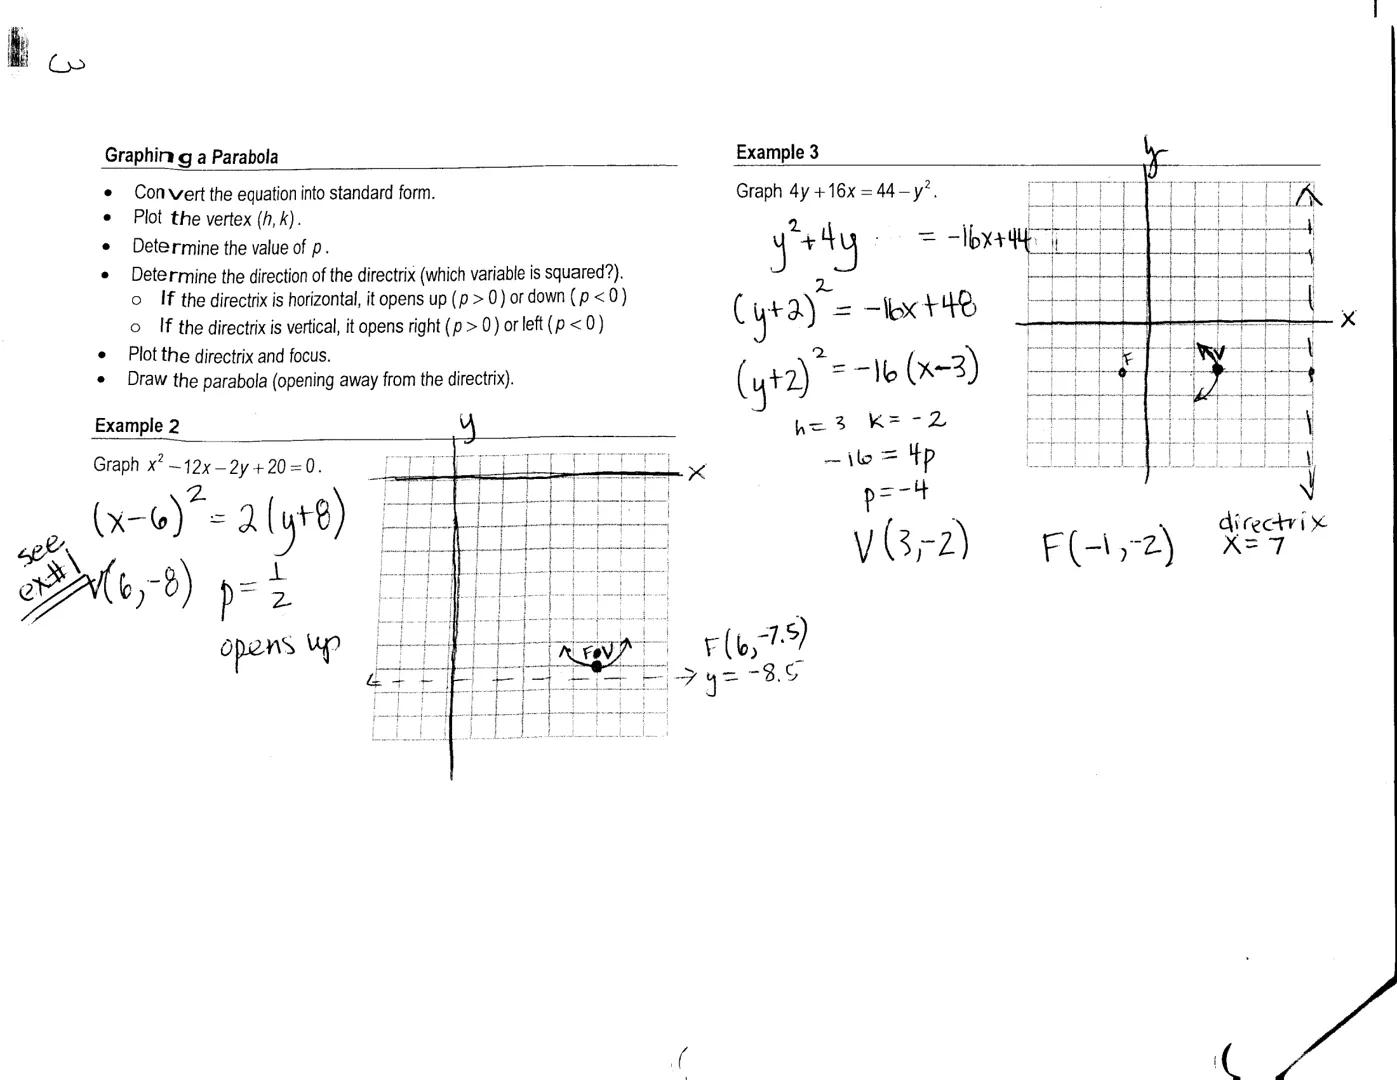
Graphing Parabolas
Graphing parabolas becomes simple with a step-by-step approach. First, convert the equation to standard form. Then plot the vertex (h,k) and determine the value of p. The variable that's squared tells you the orientation - horizontal or vertical axis.
When the directrix is horizontal, the parabola opens up (p>0) or down (p<0). When the directrix is vertical, it opens right (p>0) or left (p<0). After plotting the directrix and focus, draw the parabola opening away from the directrix.
For example, with x²-12x-2y+20=0, we found the standard form ²=2. This gives us vertex V and p=½. Since x is squared and p is positive, the parabola opens upward.
Another example: 4y+16x=44-y². Converting to standard form gives ²=-16, with vertex at and p=-4. Since y is squared and p is negative, the parabola opens to the left with focus at and directrix at x=7.
Quick Tip: When graphing, always start with the vertex as your anchor point. Everything else - the direction, focus, and directrix - can be determined from there and the value of p.
4
of 4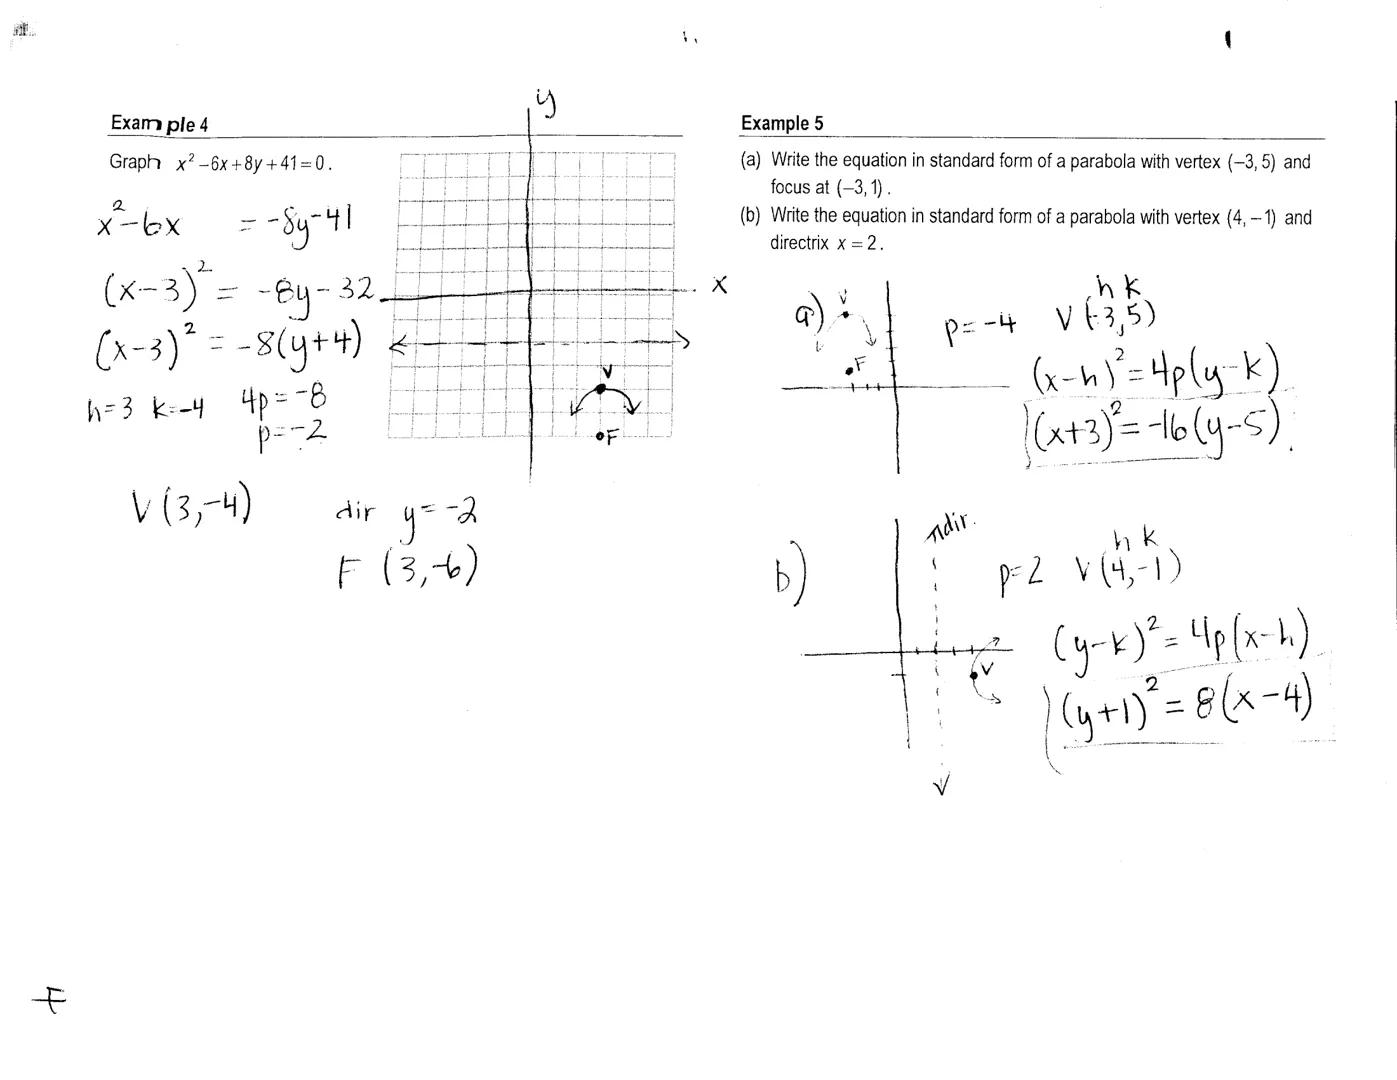
More Parabola Examples
Let's work through another graphing example: x²-6x+8y+41=0. Converting to standard form:
- x²-6x = -8y-41
- ² = -8y-32
- ² = -8
From this, we identify h=3, k=-4, and p=-2. Since x is squared and p is negative, this parabola opens downward with vertex at , focus at , and directrix at y=-2.
We can also write equations when given specific information. For example, with a vertex at and focus at , we know:
- The focus is 4 units below the vertex, so p=-4
- Since the focus and vertex share the same x-coordinate, the axis is vertical
- Thus, ² = -16
Similarly, with vertex and directrix x=2:
- The directrix is 2 units to the left of the vertex, so p=2
- This is a horizontal parabola opening right
- The equation is ² = 8
Master Skill: You can create any parabola if you know its vertex and either its focus or directrix. This is powerful for modeling real-world situations like designing reflectors or predicting projectile motion.
We thought you’d never ask...
Our AI companion is specifically built for the needs of students. Based on the millions of content pieces we have on the platform we can provide truly meaningful and relevant answers to students. But its not only about answers, the companion is even more about guiding students through their daily learning challenges, with personalised study plans, quizzes or content pieces in the chat and 100% personalisation based on the students skills and developments.
You can download the app in the Google Play Store and in the Apple App Store.
That's right! Enjoy free access to study content, connect with fellow students, and get instant help – all at your fingertips.
Similar Content
Most popular content in Pre-Calculus
9Solutions of Oblique Triangles
This is a note about solutions of oblique triangles with examples.
762
Mathematics (Solid Mensuration)
This note is all about solid mensuration, angles, and polygons. It includes formulas and sample problems with solution.
3113
Derivation
Calculus
964
AP Precalculus Notes: Unit 1 CRAM
I used a couple abbreviations in these notes, so I'll quickly define them! VA: Vertical Asymptote, HA: Horizontal Asymptote, UND: Undefined, LC: Leading Coefficient, ROC: Rate of change. Good luck! :)
10th1653
The remainder theorem and factor theorem
Notes about the topic
591
Trigonometry (Polygons)
This note is all about trigonometry, discussing the concept of polygons and how to solve problems involving polygons. It also includes formulas and sample problems.
660
Introduction to Limits and Limit Techniques
Gives an introduction to Limits and Limit techniques through graphs, explanations, and example work.
10th551
Solid Mensuration
Basic concepts on solid mensuration
681
Pythagorean Theorem
Precalculus Graphing basics, Distance Formula, Midpoint Formula
391
Most popular content
9O
Origins and Dynamics of the Columbian Exchange
Analyze the ecological and economic motivations behind the initial transfer of goods, people, and diseases between the Old and New Worlds.
9th3,1280
I
Introduction to Early Cultural Interactions
Analyze the initial social and religious encounters between Europeans, Africans, and Indigenous peoples in the colonial Americas.
9th2,7730
O
Origins of Ancient River Civilizations
Analyze the environmental factors and technological innovations that led to the rise of early states in Mesopotamia, Egypt, and the Indus Valley.
9th3,1870
M
Motivations for European Exploration
Analyze the economic, religious, and political factors that drove European powers to the Americas during the 15th and 16th centuries.
9th1,7780
F
Foundations of Ethical Guidelines in Research
Practice the core principles of the APA ethical code including informed consent, debriefing, and the role of Institutional Review Boards.
9th1,3360
I
Introduction to Native American Societies
Examine the diverse social, political, and economic structures of North American indigenous groups prior to European contact.
9th1,1100
I
Introduction to the Spanish Encomienda System
Explore the fundamental economic and social structures of the Spanish colonial system, focusing on the encomienda and the casta social hierarchy.
9th8890
I
Introduction to Biological Elements of Life
Practice identifying the essential elements including carbon, nitrogen, phosphorus, and sulfur that compose biological macromolecules.
9th1,7410
O
Origins of the Articles of Confederation
Practice identifying the motivations for a weak central government and the specific powers granted to the states under the first U.S. constitution.
9th9370
Students love us — and so will you.
4.6/5App Store
4.7/5Google Play
The app is very easy to use and well designed. I have found everything I was looking for so far and have been able to learn a lot from the presentations! I will definitely use the app for a class assignment! And of course it also helps a lot as an inspiration.
Stefan SiOS user
This app is really great. There are so many study notes and help [...]. My problem subject is French, for example, and the app has so many options for help. Thanks to this app, I have improved my French. I would recommend it to anyone.
Samantha KlichAndroid user
Wow, I am really amazed. I just tried the app because I've seen it advertised many times and was absolutely stunned. This app is THE HELP you want for school and above all, it offers so many things, such as workouts and fact sheets, which have been VERY helpful to me personally.
AnnaiOS user
Understanding Parabolas in Conic Sections
Conics are fascinating geometric shapes formed when a plane intersects with a double-napped cone. This intersection creates four basic shapes: circles, ellipses, parabolas, and hyperbolas. In this summary, we'll focus on parabolas - those U-shaped curves you've seen in everything...
1
of 4
Sign up to see the content. It's free!
- Access to all documents
- Improve your grades
- Join milions of students
Introduction to Parabolas
A parabola is a set of points that are equidistant from a fixed point (the focus) and a fixed line (the directrix). The vertex sits halfway between the focus and directrix, while the axis runs through both the focus and vertex.
Several key elements determine a parabola's appearance. The axis affects its symmetry, the focus determines its size, the directrix influences its direction, and the vertex establishes its location. When you see a parabola in standard form, you can immediately tell which way it opens and where it's positioned.
The general form of a parabola comes from the conic section equation: Ax² + Bxy + Cy² + Dx + Ey + F = 0. For parabolas specifically, B = 0, and either A = 0 or C = 0 (but not both). This gives us two possible forms:
- If C = 0: Ax² + Dx + Ey + F = 0 (opens up/down)
- If A = 0: Cy² + Dx + Ey + F = 0 (opens left/right)
Try This! Next time you see a satellite dish or the path of a ball tossed in the air, you're looking at a parabola in real life! The shape's special reflective properties make it perfect for focusing signals or following physical laws.
2
of 4Sign up to see the content. It's free!
- Access to all documents
- Improve your grades
- Join milions of students
Standard Equations of Parabolas
The standard form of a parabola with vertex at (h,k) comes in two main types, depending on which way it opens:
- ² = 4p for vertical parabolas
- ² = 4p for horizontal parabolas
The value of p is crucial - it represents the directed distance from the vertex to the focus. When p is positive, the parabola opens upward or to the right. When p is negative, it opens downward or to the left.
For vertical parabolas, the axis of symmetry is vertical , and the directrix is horizontal . For horizontal parabolas, the axis is horizontal , and the directrix is vertical . These relationships help you quickly visualize the parabola's orientation.
Let's look at an example: To convert x²-12x-2y+20=0 into standard form, we complete the square:
- x²-12x = 2y-20
- ² = 2y+16
- ² = 2 This gives us vertex with p=½, meaning it opens upward.
Remember: The variable that's squared tells you the orientation of the parabola. If x is squared, the parabola opens up/down; if y is squared, it opens left/right.
3
of 4Sign up to see the content. It's free!
- Access to all documents
- Improve your grades
- Join milions of students
Graphing Parabolas
Graphing parabolas becomes simple with a step-by-step approach. First, convert the equation to standard form. Then plot the vertex (h,k) and determine the value of p. The variable that's squared tells you the orientation - horizontal or vertical axis.
When the directrix is horizontal, the parabola opens up (p>0) or down (p<0). When the directrix is vertical, it opens right (p>0) or left (p<0). After plotting the directrix and focus, draw the parabola opening away from the directrix.
For example, with x²-12x-2y+20=0, we found the standard form ²=2. This gives us vertex V and p=½. Since x is squared and p is positive, the parabola opens upward.
Another example: 4y+16x=44-y². Converting to standard form gives ²=-16, with vertex at and p=-4. Since y is squared and p is negative, the parabola opens to the left with focus at and directrix at x=7.
Quick Tip: When graphing, always start with the vertex as your anchor point. Everything else - the direction, focus, and directrix - can be determined from there and the value of p.
4
of 4Sign up to see the content. It's free!
- Access to all documents
- Improve your grades
- Join milions of students
More Parabola Examples
Let's work through another graphing example: x²-6x+8y+41=0. Converting to standard form:
- x²-6x = -8y-41
- ² = -8y-32
- ² = -8
From this, we identify h=3, k=-4, and p=-2. Since x is squared and p is negative, this parabola opens downward with vertex at , focus at , and directrix at y=-2.
We can also write equations when given specific information. For example, with a vertex at and focus at , we know:
- The focus is 4 units below the vertex, so p=-4
- Since the focus and vertex share the same x-coordinate, the axis is vertical
- Thus, ² = -16
Similarly, with vertex and directrix x=2:
- The directrix is 2 units to the left of the vertex, so p=2
- This is a horizontal parabola opening right
- The equation is ² = 8
Master Skill: You can create any parabola if you know its vertex and either its focus or directrix. This is powerful for modeling real-world situations like designing reflectors or predicting projectile motion.
We thought you’d never ask...
Our AI companion is specifically built for the needs of students. Based on the millions of content pieces we have on the platform we can provide truly meaningful and relevant answers to students. But its not only about answers, the companion is even more about guiding students through their daily learning challenges, with personalised study plans, quizzes or content pieces in the chat and 100% personalisation based on the students skills and developments.
You can download the app in the Google Play Store and in the Apple App Store.
That's right! Enjoy free access to study content, connect with fellow students, and get instant help – all at your fingertips.
Similar Content
Most popular content in Pre-Calculus
9Solutions of Oblique Triangles
This is a note about solutions of oblique triangles with examples.
762
Mathematics (Solid Mensuration)
This note is all about solid mensuration, angles, and polygons. It includes formulas and sample problems with solution.
3113
Derivation
Calculus
964
AP Precalculus Notes: Unit 1 CRAM
I used a couple abbreviations in these notes, so I'll quickly define them! VA: Vertical Asymptote, HA: Horizontal Asymptote, UND: Undefined, LC: Leading Coefficient, ROC: Rate of change. Good luck! :)
10th1653
The remainder theorem and factor theorem
Notes about the topic
591
Trigonometry (Polygons)
This note is all about trigonometry, discussing the concept of polygons and how to solve problems involving polygons. It also includes formulas and sample problems.
660
Introduction to Limits and Limit Techniques
Gives an introduction to Limits and Limit techniques through graphs, explanations, and example work.
10th551
Solid Mensuration
Basic concepts on solid mensuration
681
Pythagorean Theorem
Precalculus Graphing basics, Distance Formula, Midpoint Formula
391
Most popular content
9O
Origins and Dynamics of the Columbian Exchange
Analyze the ecological and economic motivations behind the initial transfer of goods, people, and diseases between the Old and New Worlds.
9th3,1280
I
Introduction to Early Cultural Interactions
Analyze the initial social and religious encounters between Europeans, Africans, and Indigenous peoples in the colonial Americas.
9th2,7730
O
Origins of Ancient River Civilizations
Analyze the environmental factors and technological innovations that led to the rise of early states in Mesopotamia, Egypt, and the Indus Valley.
9th3,1870
M
Motivations for European Exploration
Analyze the economic, religious, and political factors that drove European powers to the Americas during the 15th and 16th centuries.
9th1,7780
F
Foundations of Ethical Guidelines in Research
Practice the core principles of the APA ethical code including informed consent, debriefing, and the role of Institutional Review Boards.
9th1,3360
I
Introduction to Native American Societies
Examine the diverse social, political, and economic structures of North American indigenous groups prior to European contact.
9th1,1100
I
Introduction to the Spanish Encomienda System
Explore the fundamental economic and social structures of the Spanish colonial system, focusing on the encomienda and the casta social hierarchy.
9th8890
I
Introduction to Biological Elements of Life
Practice identifying the essential elements including carbon, nitrogen, phosphorus, and sulfur that compose biological macromolecules.
9th1,7410
O
Origins of the Articles of Confederation
Practice identifying the motivations for a weak central government and the specific powers granted to the states under the first U.S. constitution.
9th9370
Students love us — and so will you.
4.6/5App Store
4.7/5Google Play
The app is very easy to use and well designed. I have found everything I was looking for so far and have been able to learn a lot from the presentations! I will definitely use the app for a class assignment! And of course it also helps a lot as an inspiration.
Stefan SiOS user
This app is really great. There are so many study notes and help [...]. My problem subject is French, for example, and the app has so many options for help. Thanks to this app, I have improved my French. I would recommend it to anyone.
Samantha KlichAndroid user
Wow, I am really amazed. I just tried the app because I've seen it advertised many times and was absolutely stunned. This app is THE HELP you want for school and above all, it offers so many things, such as workouts and fact sheets, which have been VERY helpful to me personally.
AnnaiOS user