Statistics is basically the science of collecting and making sense... Show more
Sign up to see the contentIt's free!
Access to all documents
Improve your grades
Join milions of students
By signing up you accept Terms of Service and Privacy Policy
Biology
Chemistry
AP Chemistry
English
AP English Literature
42
•
Dec 10, 2025
•
Reigh<3
@reigh0fsunshine
Statistics is basically the science of collecting and making sense... Show more


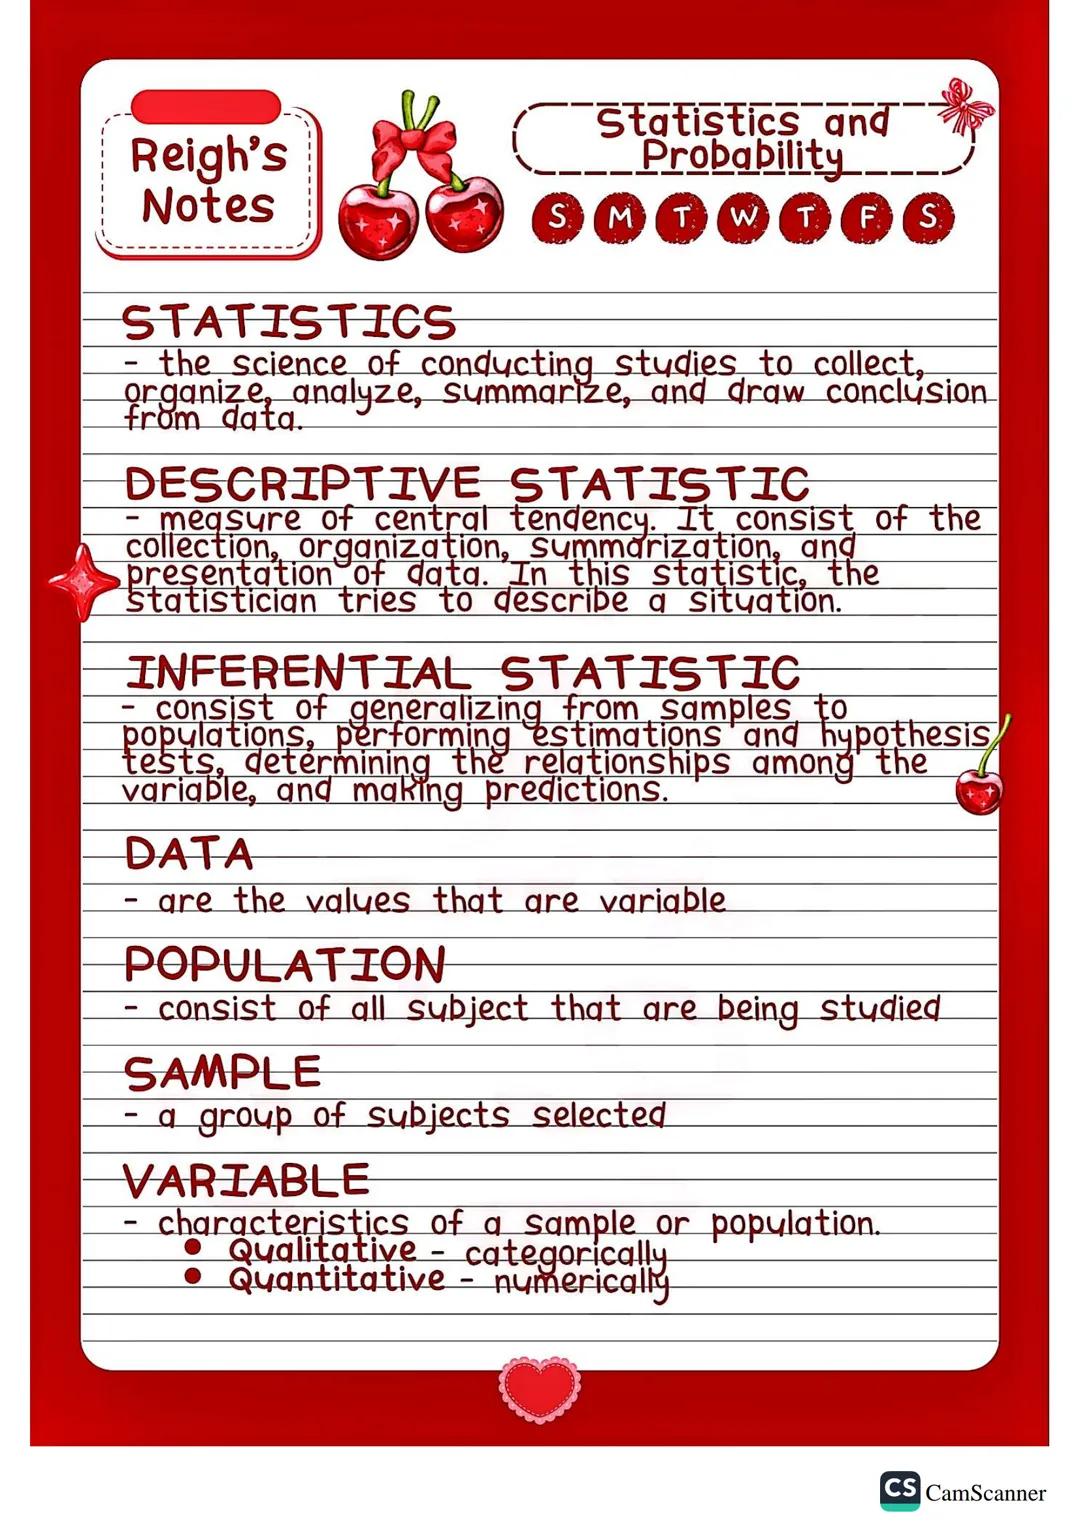
Think of statistics as your toolkit for handling data - it's how we collect, organize, analyze, and draw conclusions from numbers. You'll use these skills everywhere, from understanding poll results to analyzing your own academic performance.
There are two main types of statistics you need to know. Descriptive statistics help you describe what's happening right now - like finding the average grade in your class or creating charts to show data patterns. Inferential statistics go a step further by helping you make predictions and draw conclusions about larger groups based on smaller samples.
Understanding the difference between population (everyone you're studying) and sample (the smaller group you actually collect data from) is crucial. For example, if you want to know about all Grade 11 students in the Philippines, that's your population - but you might only survey students from a few schools as your sample.
Quick Tip: Variables can be qualitative (like favorite subjects or colors) or quantitative (like test scores or heights). Knowing which type you're working with determines how you'll analyze your data.
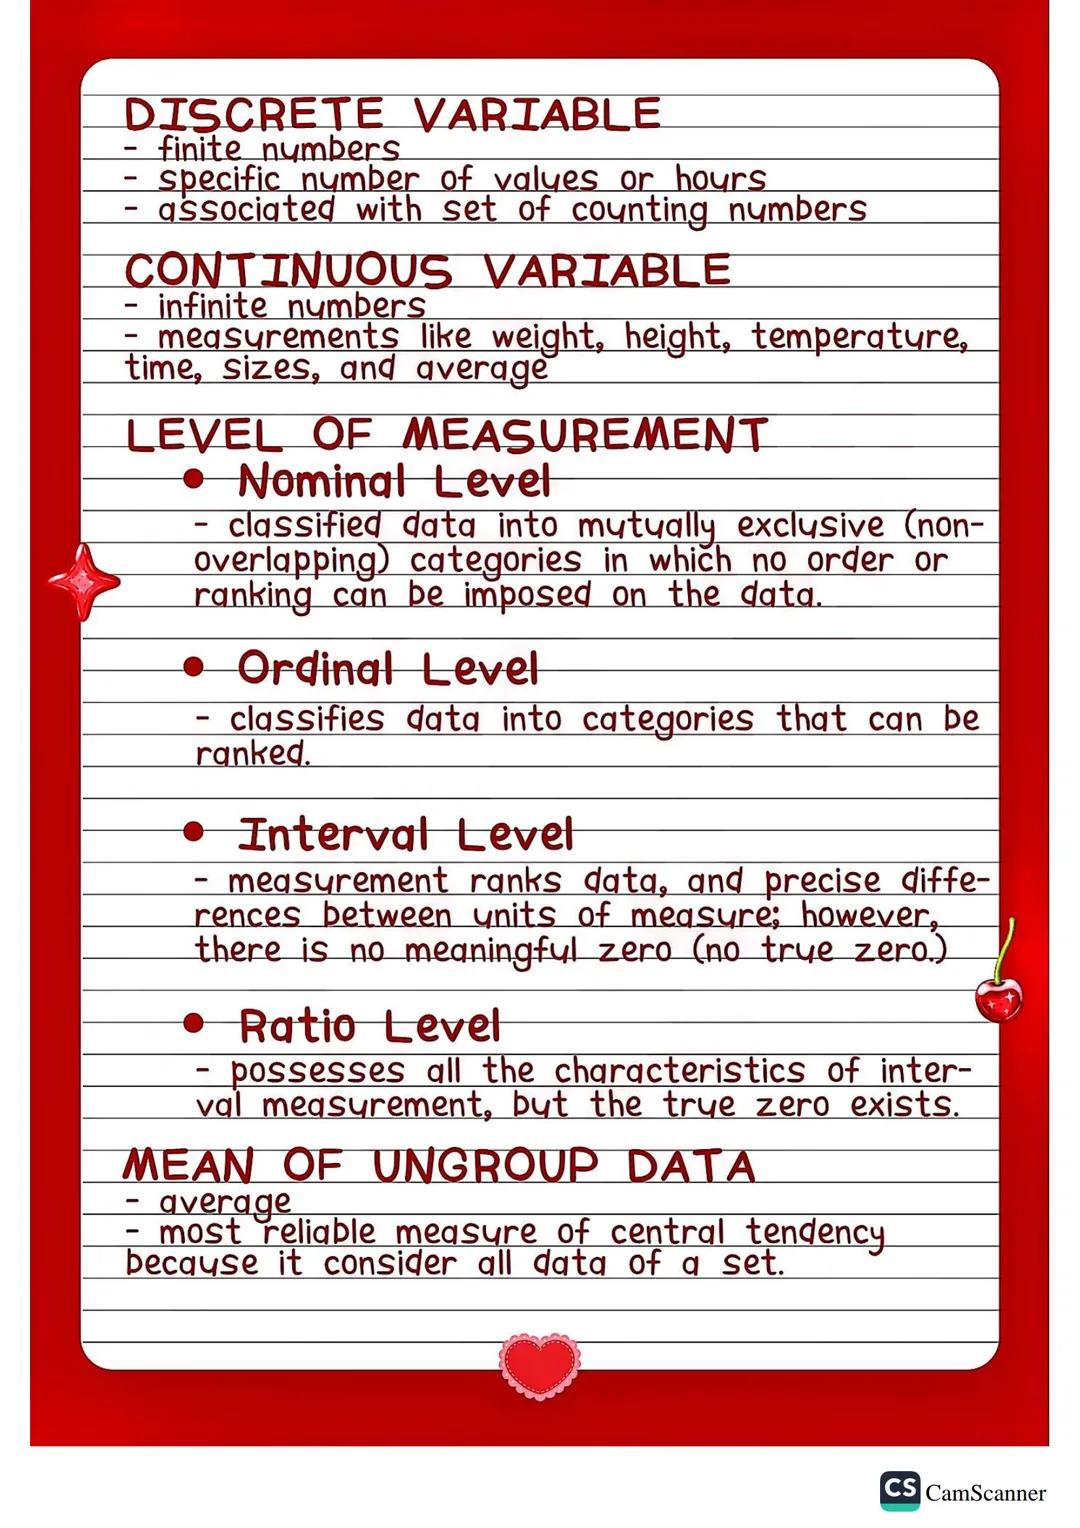
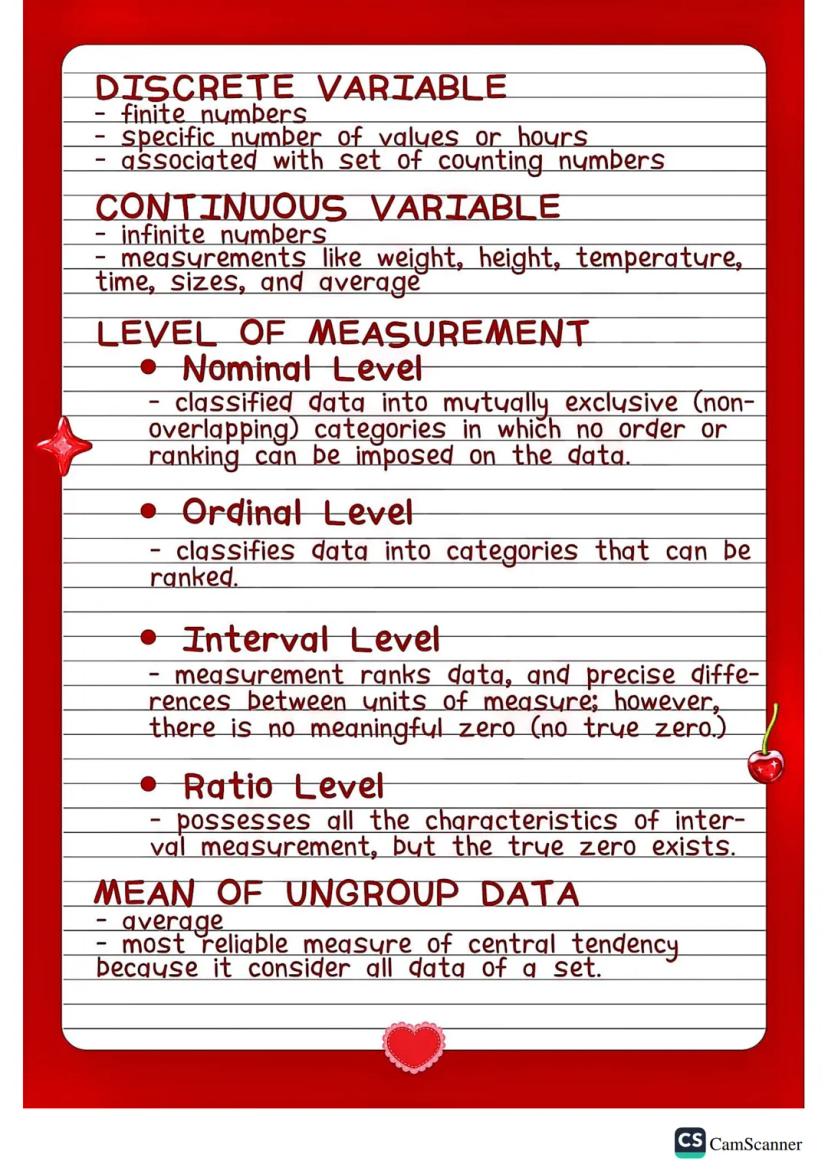
Discrete variables deal with specific, countable numbers - think of things you can list out exactly like the number of siblings you have or books on a shelf. Continuous variables involve measurements that can have infinite possibilities, like your exact height, weight, or the time it takes to run a kilometer.
The level of measurement determines what you can do with your data. Nominal level is just categorizing (like school subjects or blood types) with no ranking involved. Ordinal level adds ranking but without precise differences - think grade levels or satisfaction ratings from "poor" to "excellent."
Interval level gives you precise differences between measurements but no true zero point (like temperature in Celsius). Ratio level has everything interval has plus a meaningful zero point (like your quiz scores or income).
Remember: The measurement level determines which statistical methods you can use - you can't calculate a meaningful average for nominal data like favorite colors!
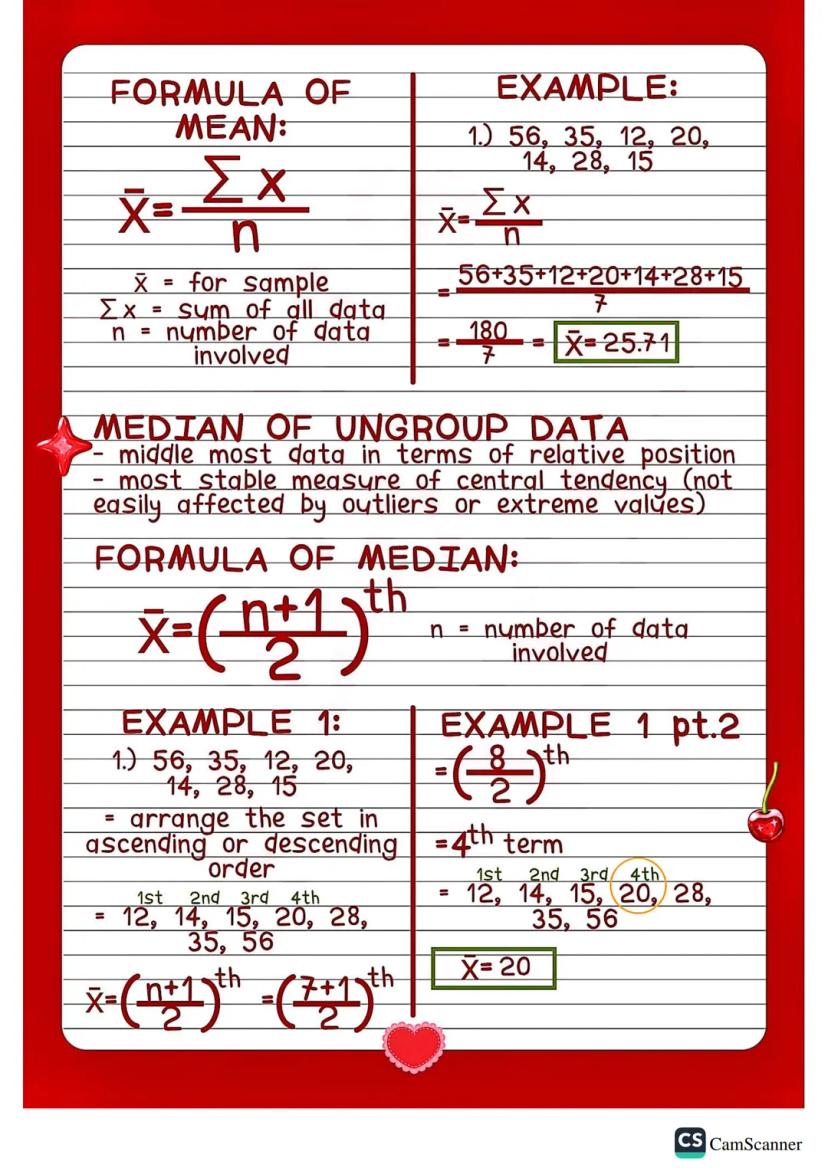
The mean (average) is your most reliable measure because it considers every single data point in your set. Use the formula X̄ = ΣX/n where you add up all values and divide by how many numbers you have. For example, with test scores 56, 35, 12, 20, 14, 28, 15, you'd get (56+35+12+20+14+28+15)/7 = 25.71.
The median finds the middle value and isn't easily thrown off by extreme scores. First, arrange your data in order from smallest to largest. Then use the formula /2 to find which position holds your median.
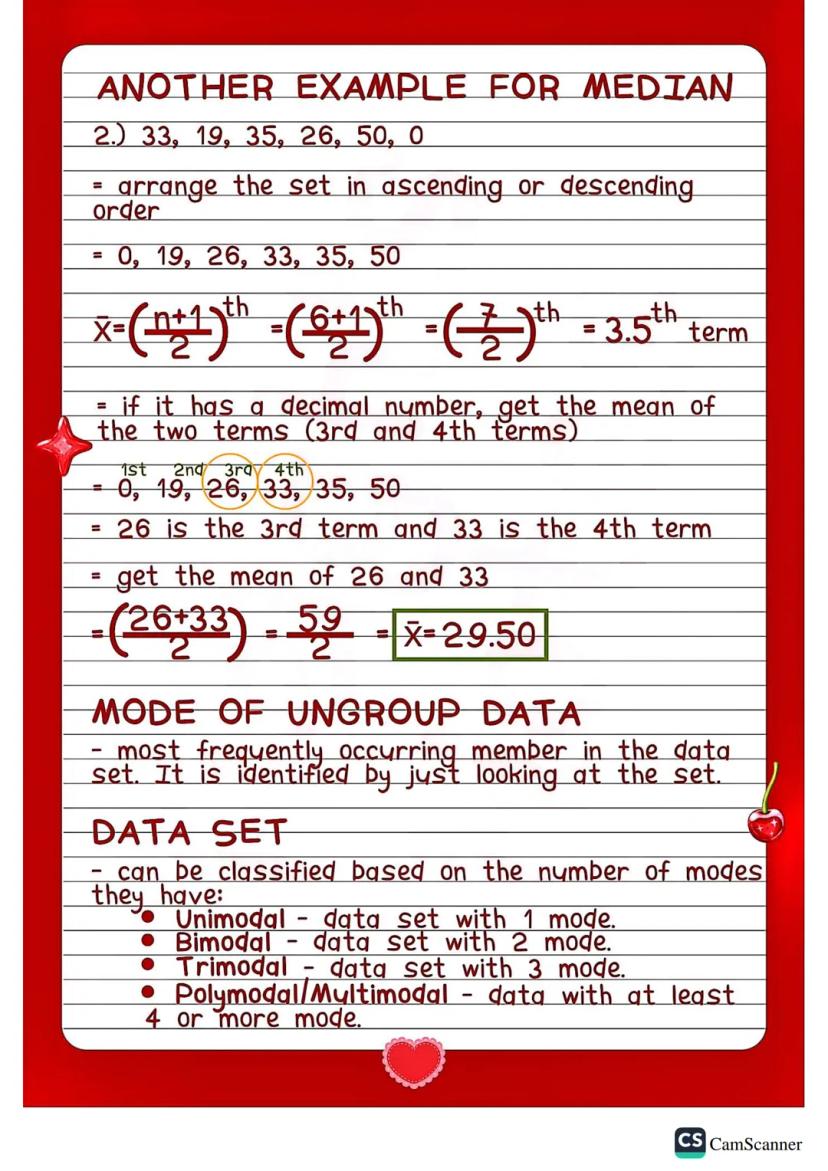
With an odd number of data points, you'll get a whole number that points directly to your median. With an even number of data points, you'll get a decimal (like 3.5th position), which means you average the two middle values.
Pro Tip: Median is super useful when you have outliers - like if one person scored 100 while everyone else scored around 75, the median gives you a better picture than the mean.
Mode is the easiest measure to find - just look for the number that appears most often in your data set. Unlike mean and median, mode works perfectly with both numerical and categorical data (like finding the most popular subject among students).
Your data sets get classified by how many modes they have. Unimodal means one most frequent value, bimodal means two values tie for most frequent, and trimodal means three values appear most often. When you have four or more modes, call it polymodal or multimodal.
Sometimes you might have no mode at all - this happens when every value appears the same number of times. Other times, especially with categorical data like favorite movies or sports teams, mode might be your only meaningful measure of central tendency.
Real-world Application: Mode is perfect for business decisions - like which pizza flavor to stock most of, or which class schedule time slots are most popular with students.

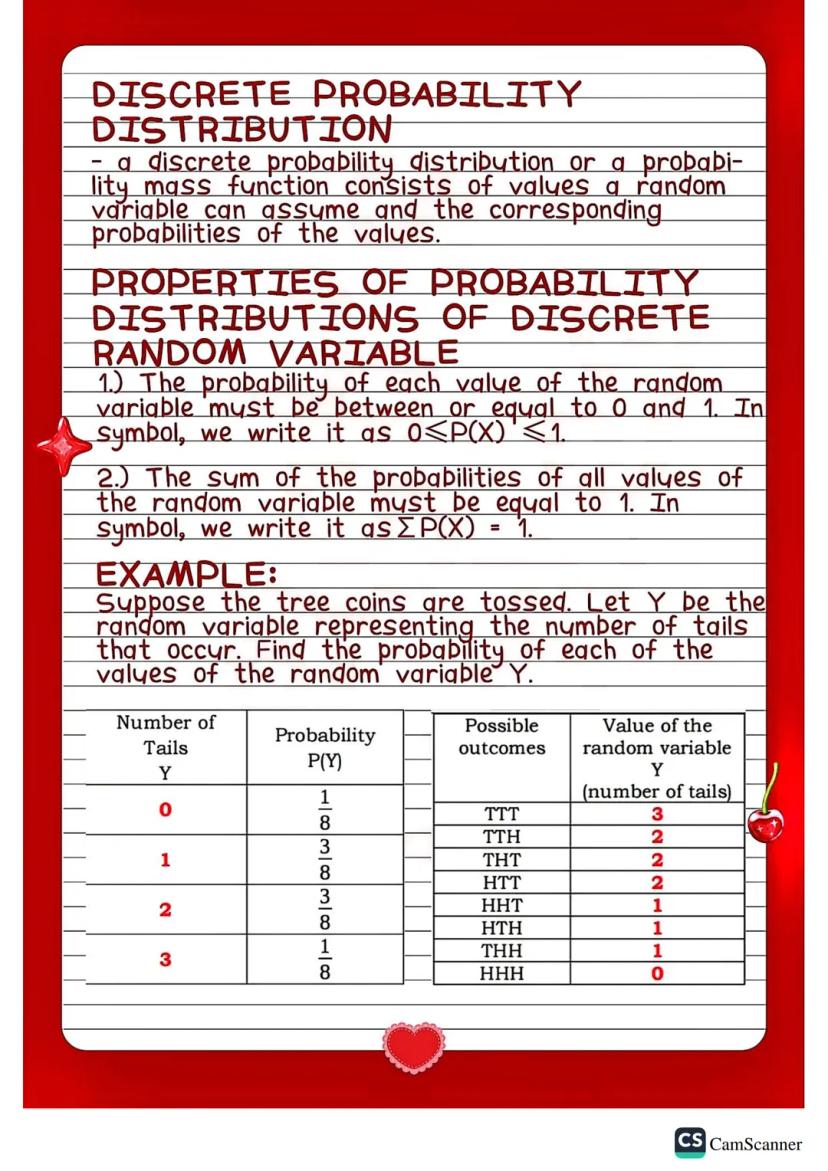
Discrete probability distribution shows you all possible outcomes of a random variable and their chances of occurring. Think of it like a complete map of what could happen and how likely each possibility is.
Every probability distribution follows two essential rules. First, each probability must be between 0 and 1 (written as 0≤P(X)≤1) - you can't have negative chances or chances over 100%. Second, all probabilities must add up to exactly 1 (written as ΣP(X) = 1) because something has to happen.
The coin example shows this perfectly: when flipping three coins and counting tails, you could get 0, 1, 2, or 3 tails. Each outcome has its specific probability (1/8, 3/8, 3/8, 1/8), and notice how they all add up to 1.
Study Strategy: Practice identifying all possible outcomes first, then calculate their probabilities - this systematic approach prevents you from missing possibilities or making calculation errors.
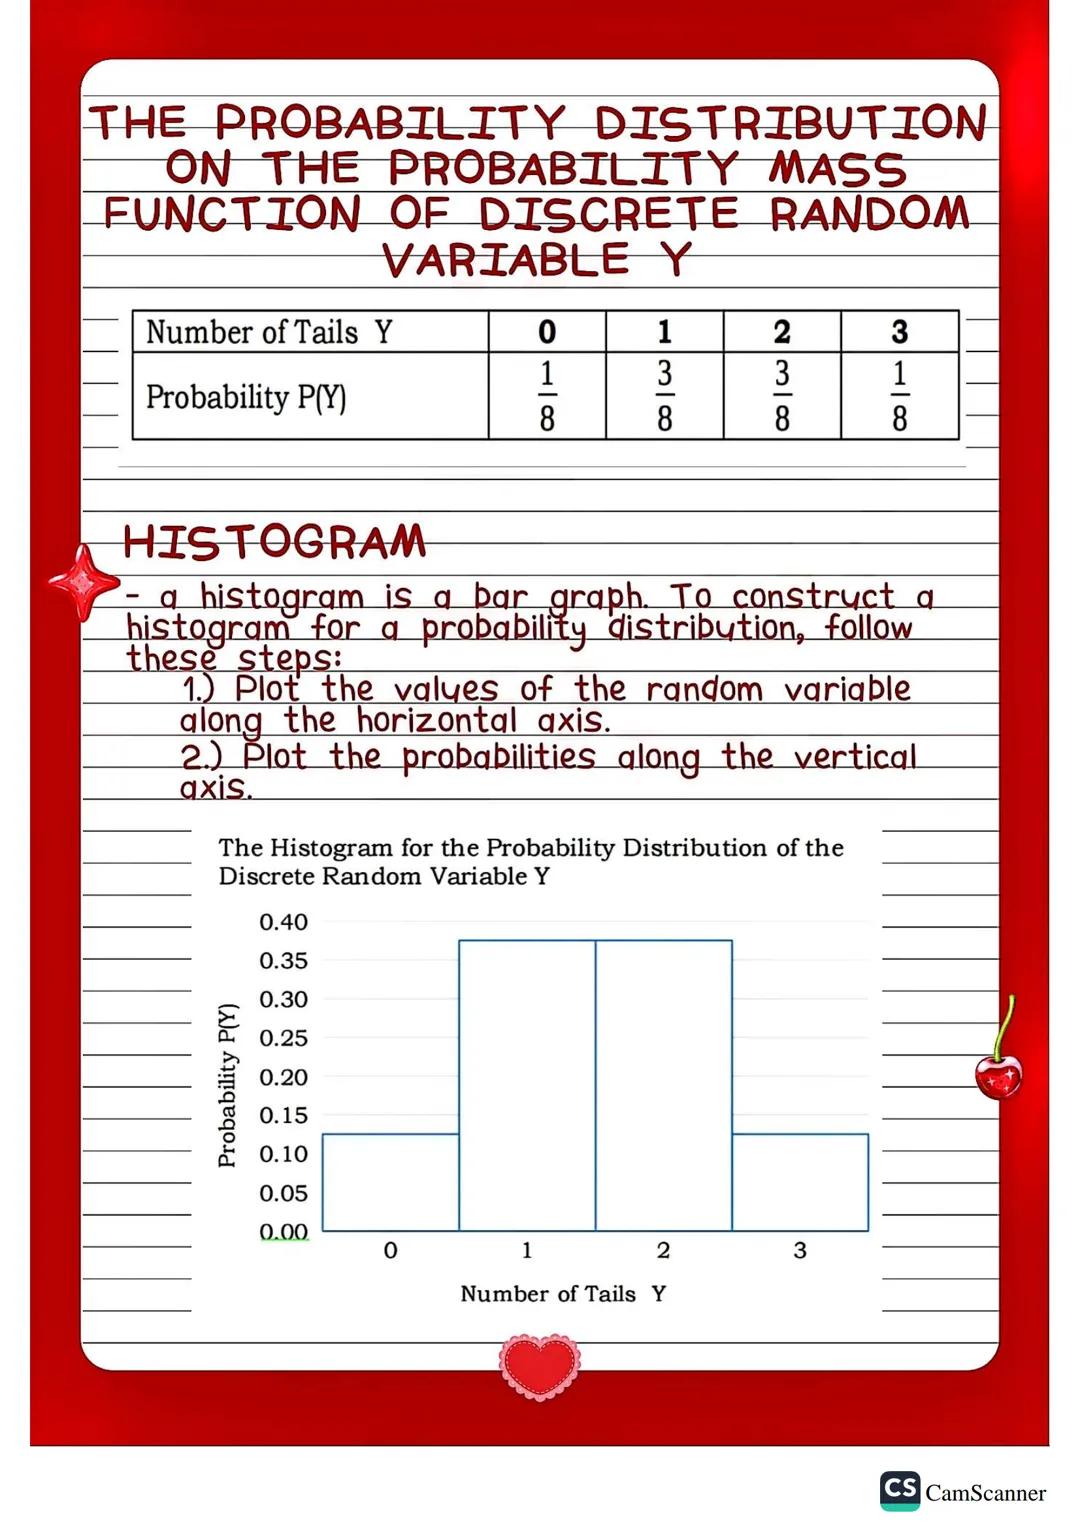
Probability distribution tables organize your random variable values with their corresponding probabilities in a clean, easy-to-read format. This makes it simple to see patterns and verify that your probabilities follow the required rules.
Creating a histogram for probability distributions involves plotting random variable values on the horizontal axis and probabilities on the vertical axis. This visual representation helps you quickly identify which outcomes are most and least likely to occur.
The histogram becomes especially powerful when comparing different probability distributions or explaining your results to others. Bar heights immediately show probability differences, making complex statistical concepts much more accessible and understandable.
Visual Learning Tip: Always double-check that your histogram bars correspond to the correct probabilities in your table - visual accuracy is crucial for proper statistical interpretation.
Our AI companion is specifically built for the needs of students. Based on the millions of content pieces we have on the platform we can provide truly meaningful and relevant answers to students. But its not only about answers, the companion is even more about guiding students through their daily learning challenges, with personalised study plans, quizzes or content pieces in the chat and 100% personalisation based on the students skills and developments.
You can download the app in the Google Play Store and in the Apple App Store.
That's right! Enjoy free access to study content, connect with fellow students, and get instant help – all at your fingertips.
Master the three forms of quadratic equations and their key properties
App Store
Google Play
The app is very easy to use and well designed. I have found everything I was looking for so far and have been able to learn a lot from the presentations! I will definitely use the app for a class assignment! And of course it also helps a lot as an inspiration.
Stefan S
iOS user
This app is really great. There are so many study notes and help [...]. My problem subject is French, for example, and the app has so many options for help. Thanks to this app, I have improved my French. I would recommend it to anyone.
Samantha Klich
Android user
Wow, I am really amazed. I just tried the app because I've seen it advertised many times and was absolutely stunned. This app is THE HELP you want for school and above all, it offers so many things, such as workouts and fact sheets, which have been VERY helpful to me personally.
Anna
iOS user
I think it’s very much worth it and you’ll end up using it a lot once you get the hang of it and even after looking at others notes you can still ask your Artificial intelligence buddy the question and ask to simplify it if you still don’t get it!!! In the end I think it’s worth it 😊👍 ⚠️Also DID I MENTION ITS FREEE YOU DON’T HAVE TO PAY FOR ANYTHING AND STILL GET YOUR GRADES IN PERFECTLY❗️❗️⚠️
Thomas R
iOS user
Knowunity is the BEST app I’ve used in a minute. This is not an ai review or anything this is genuinely coming from a 7th grade student (I know 2011 im young) but dude this app is a 10/10 i have maintained a 3.8 gpa and have plenty of time for gaming. I love it and my mom is just happy I got good grades
Brad T
Android user
Not only did it help me find the answer but it also showed me alternative ways to solve it. I was horrible in math and science but now I have an a in both subjects. Thanks for the help🤍🤍
David K
iOS user
The app's just great! All I have to do is enter the topic in the search bar and I get the response real fast. I don't have to watch 10 YouTube videos to understand something, so I'm saving my time. Highly recommended!
Sudenaz Ocak
Android user
In school I was really bad at maths but thanks to the app, I am doing better now. I am so grateful that you made the app.
Greenlight Bonnie
Android user
I found this app a couple years ago and it has only gotten better since then. I really love it because it can help with written questions and photo questions. Also, it can find study guides that other people have made as well as flashcard sets and practice tests. The free version is also amazing for students who might not be able to afford it. Would 100% recommend
Aubrey
iOS user
Best app if you're in Highschool or Junior high. I have been using this app for 2 school years and it's the best, it's good if you don't have anyone to help you with school work.😋🩷🎀
Marco B
iOS user
THE QUIZES AND FLASHCARDS ARE SO USEFUL AND I LOVE THE SCHOOLGPT. IT ALSO IS LITREALLY LIKE CHATGPT BUT SMARTER!! HELPED ME WITH MY MASCARA PROBLEMS TOO!! AS WELL AS MY REAL SUBJECTS ! DUHHH 😍😁😲🤑💗✨🎀😮
Elisha
iOS user
This app is phenomenal down to the correct info and the various topics you can study! I greatly recommend it for people who struggle with procrastination and those who need homework help. It has been perfectly accurate for world 1 history as far as I’ve seen! Geometry too!
Paul T
iOS user
Reigh<3
@reigh0fsunshine
Statistics is basically the science of collecting and making sense of data to draw meaningful conclusions. Whether you're analyzing test scores, survey results, or experimental data, understanding statistics helps you organize information and make smart decisions based on what the... Show more
Access to all documents
Improve your grades
Join milions of students
By signing up you accept Terms of Service and Privacy Policy
Think of statistics as your toolkit for handling data - it's how we collect, organize, analyze, and draw conclusions from numbers. You'll use these skills everywhere, from understanding poll results to analyzing your own academic performance.
There are two main types of statistics you need to know. Descriptive statistics help you describe what's happening right now - like finding the average grade in your class or creating charts to show data patterns. Inferential statistics go a step further by helping you make predictions and draw conclusions about larger groups based on smaller samples.
Understanding the difference between population (everyone you're studying) and sample (the smaller group you actually collect data from) is crucial. For example, if you want to know about all Grade 11 students in the Philippines, that's your population - but you might only survey students from a few schools as your sample.
Quick Tip: Variables can be qualitative (like favorite subjects or colors) or quantitative (like test scores or heights). Knowing which type you're working with determines how you'll analyze your data.
Access to all documents
Improve your grades
Join milions of students
By signing up you accept Terms of Service and Privacy Policy
Discrete variables deal with specific, countable numbers - think of things you can list out exactly like the number of siblings you have or books on a shelf. Continuous variables involve measurements that can have infinite possibilities, like your exact height, weight, or the time it takes to run a kilometer.
The level of measurement determines what you can do with your data. Nominal level is just categorizing (like school subjects or blood types) with no ranking involved. Ordinal level adds ranking but without precise differences - think grade levels or satisfaction ratings from "poor" to "excellent."
Interval level gives you precise differences between measurements but no true zero point (like temperature in Celsius). Ratio level has everything interval has plus a meaningful zero point (like your quiz scores or income).
Remember: The measurement level determines which statistical methods you can use - you can't calculate a meaningful average for nominal data like favorite colors!
Access to all documents
Improve your grades
Join milions of students
By signing up you accept Terms of Service and Privacy Policy
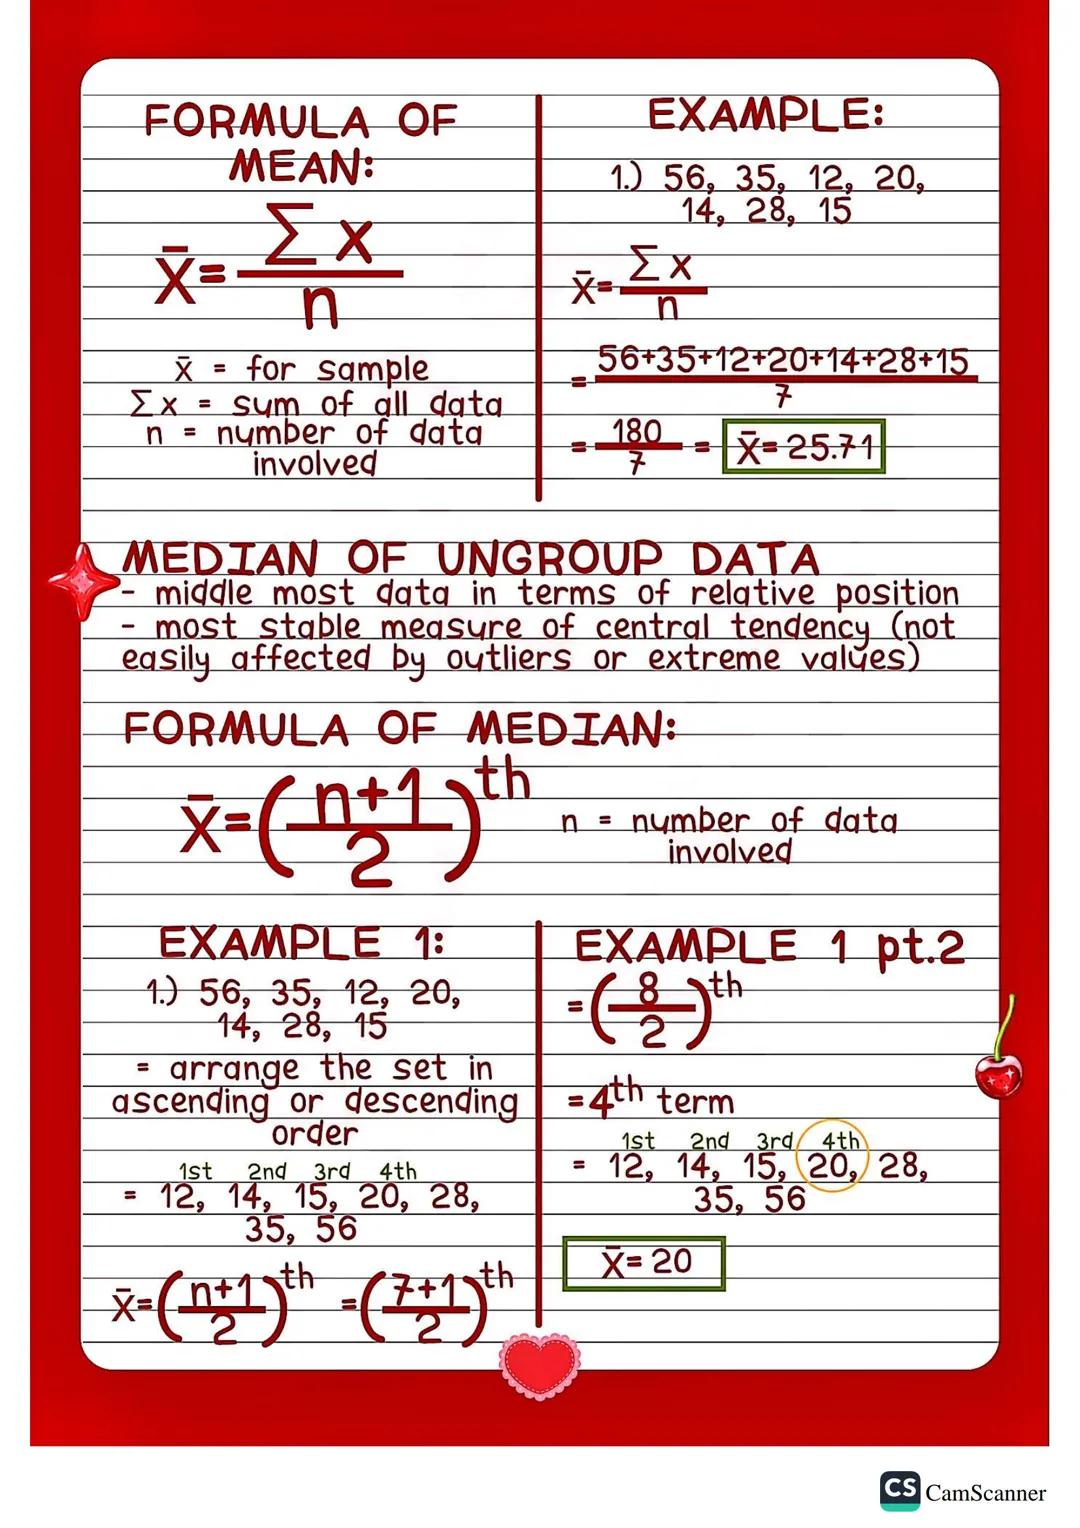
The mean (average) is your most reliable measure because it considers every single data point in your set. Use the formula X̄ = ΣX/n where you add up all values and divide by how many numbers you have. For example, with test scores 56, 35, 12, 20, 14, 28, 15, you'd get (56+35+12+20+14+28+15)/7 = 25.71.
The median finds the middle value and isn't easily thrown off by extreme scores. First, arrange your data in order from smallest to largest. Then use the formula /2 to find which position holds your median.
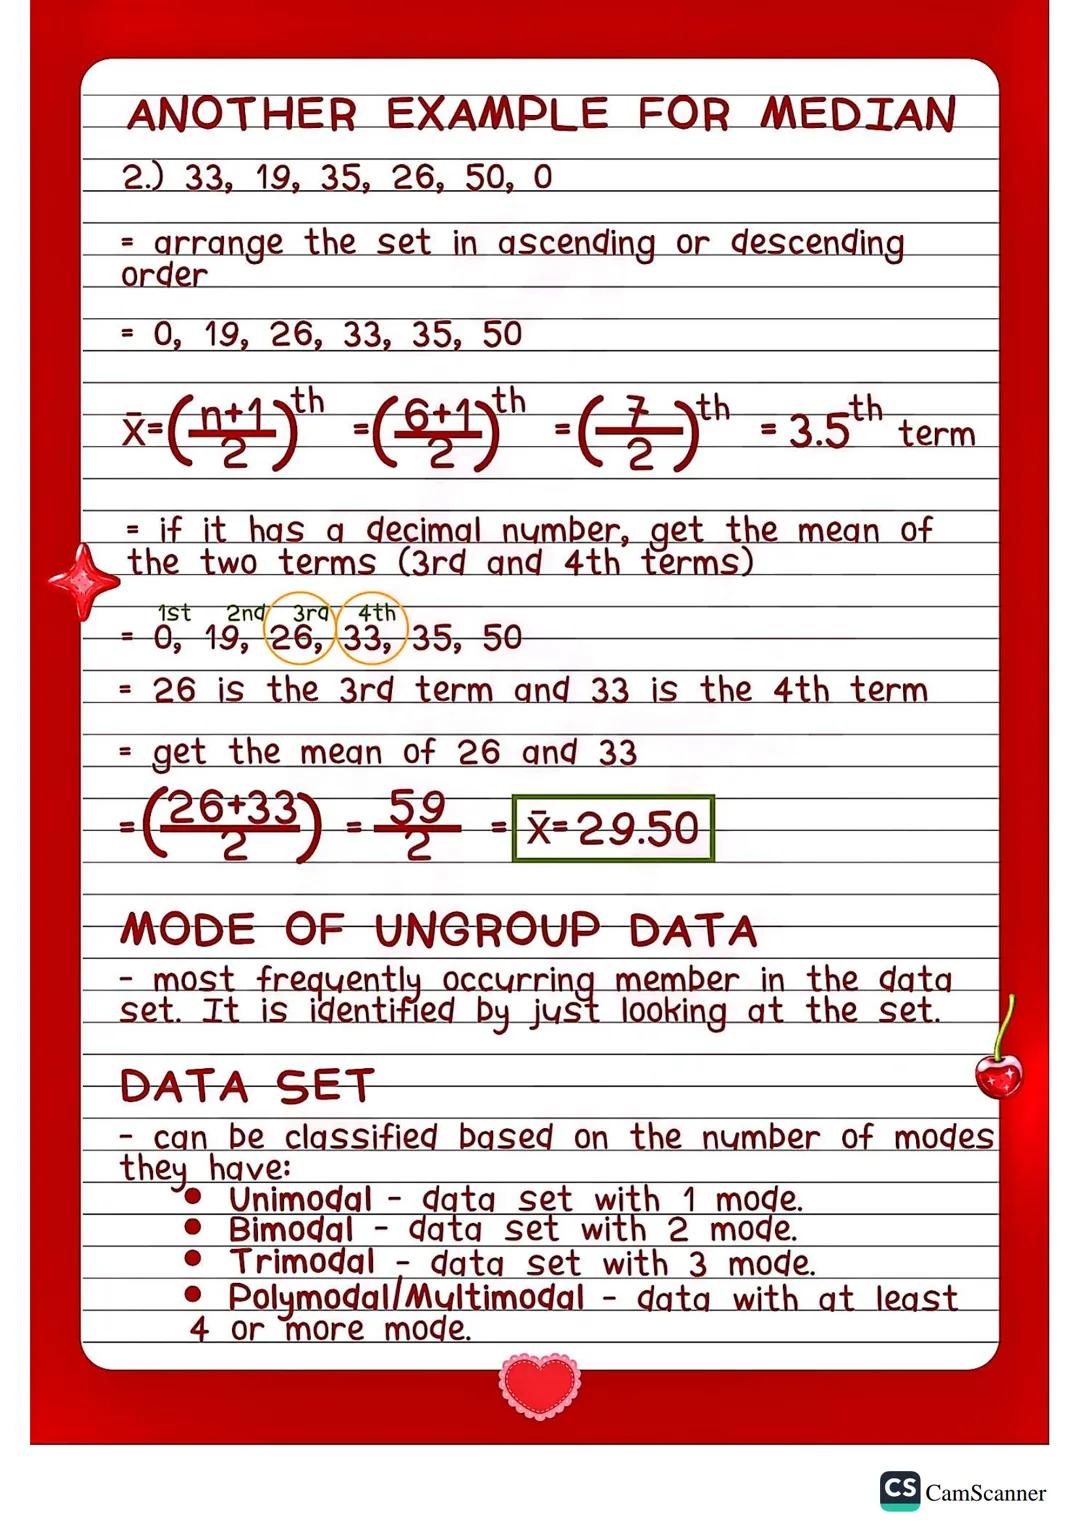
With an odd number of data points, you'll get a whole number that points directly to your median. With an even number of data points, you'll get a decimal (like 3.5th position), which means you average the two middle values.
Pro Tip: Median is super useful when you have outliers - like if one person scored 100 while everyone else scored around 75, the median gives you a better picture than the mean.
Access to all documents
Improve your grades
Join milions of students
By signing up you accept Terms of Service and Privacy Policy
Mode is the easiest measure to find - just look for the number that appears most often in your data set. Unlike mean and median, mode works perfectly with both numerical and categorical data (like finding the most popular subject among students).
Your data sets get classified by how many modes they have. Unimodal means one most frequent value, bimodal means two values tie for most frequent, and trimodal means three values appear most often. When you have four or more modes, call it polymodal or multimodal.
Sometimes you might have no mode at all - this happens when every value appears the same number of times. Other times, especially with categorical data like favorite movies or sports teams, mode might be your only meaningful measure of central tendency.
Real-world Application: Mode is perfect for business decisions - like which pizza flavor to stock most of, or which class schedule time slots are most popular with students.
Access to all documents
Improve your grades
Join milions of students
By signing up you accept Terms of Service and Privacy Policy
Discrete probability distribution shows you all possible outcomes of a random variable and their chances of occurring. Think of it like a complete map of what could happen and how likely each possibility is.
Every probability distribution follows two essential rules. First, each probability must be between 0 and 1 (written as 0≤P(X)≤1) - you can't have negative chances or chances over 100%. Second, all probabilities must add up to exactly 1 (written as ΣP(X) = 1) because something has to happen.
The coin example shows this perfectly: when flipping three coins and counting tails, you could get 0, 1, 2, or 3 tails. Each outcome has its specific probability (1/8, 3/8, 3/8, 1/8), and notice how they all add up to 1.
Study Strategy: Practice identifying all possible outcomes first, then calculate their probabilities - this systematic approach prevents you from missing possibilities or making calculation errors.
Access to all documents
Improve your grades
Join milions of students
By signing up you accept Terms of Service and Privacy Policy
Probability distribution tables organize your random variable values with their corresponding probabilities in a clean, easy-to-read format. This makes it simple to see patterns and verify that your probabilities follow the required rules.
Creating a histogram for probability distributions involves plotting random variable values on the horizontal axis and probabilities on the vertical axis. This visual representation helps you quickly identify which outcomes are most and least likely to occur.
The histogram becomes especially powerful when comparing different probability distributions or explaining your results to others. Bar heights immediately show probability differences, making complex statistical concepts much more accessible and understandable.
Visual Learning Tip: Always double-check that your histogram bars correspond to the correct probabilities in your table - visual accuracy is crucial for proper statistical interpretation.
Our AI companion is specifically built for the needs of students. Based on the millions of content pieces we have on the platform we can provide truly meaningful and relevant answers to students. But its not only about answers, the companion is even more about guiding students through their daily learning challenges, with personalised study plans, quizzes or content pieces in the chat and 100% personalisation based on the students skills and developments.
You can download the app in the Google Play Store and in the Apple App Store.
That's right! Enjoy free access to study content, connect with fellow students, and get instant help – all at your fingertips.
2
Smart Tools NEW
Transform this note into: ✓ 50+ Practice Questions ✓ Interactive Flashcards ✓ Full Mock Exam ✓ Essay Outlines
Master the three forms of quadratic equations and their key properties
App Store
Google Play
The app is very easy to use and well designed. I have found everything I was looking for so far and have been able to learn a lot from the presentations! I will definitely use the app for a class assignment! And of course it also helps a lot as an inspiration.
Stefan S
iOS user
This app is really great. There are so many study notes and help [...]. My problem subject is French, for example, and the app has so many options for help. Thanks to this app, I have improved my French. I would recommend it to anyone.
Samantha Klich
Android user
Wow, I am really amazed. I just tried the app because I've seen it advertised many times and was absolutely stunned. This app is THE HELP you want for school and above all, it offers so many things, such as workouts and fact sheets, which have been VERY helpful to me personally.
Anna
iOS user
I think it’s very much worth it and you’ll end up using it a lot once you get the hang of it and even after looking at others notes you can still ask your Artificial intelligence buddy the question and ask to simplify it if you still don’t get it!!! In the end I think it’s worth it 😊👍 ⚠️Also DID I MENTION ITS FREEE YOU DON’T HAVE TO PAY FOR ANYTHING AND STILL GET YOUR GRADES IN PERFECTLY❗️❗️⚠️
Thomas R
iOS user
Knowunity is the BEST app I’ve used in a minute. This is not an ai review or anything this is genuinely coming from a 7th grade student (I know 2011 im young) but dude this app is a 10/10 i have maintained a 3.8 gpa and have plenty of time for gaming. I love it and my mom is just happy I got good grades
Brad T
Android user
Not only did it help me find the answer but it also showed me alternative ways to solve it. I was horrible in math and science but now I have an a in both subjects. Thanks for the help🤍🤍
David K
iOS user
The app's just great! All I have to do is enter the topic in the search bar and I get the response real fast. I don't have to watch 10 YouTube videos to understand something, so I'm saving my time. Highly recommended!
Sudenaz Ocak
Android user
In school I was really bad at maths but thanks to the app, I am doing better now. I am so grateful that you made the app.
Greenlight Bonnie
Android user
I found this app a couple years ago and it has only gotten better since then. I really love it because it can help with written questions and photo questions. Also, it can find study guides that other people have made as well as flashcard sets and practice tests. The free version is also amazing for students who might not be able to afford it. Would 100% recommend
Aubrey
iOS user
Best app if you're in Highschool or Junior high. I have been using this app for 2 school years and it's the best, it's good if you don't have anyone to help you with school work.😋🩷🎀
Marco B
iOS user
THE QUIZES AND FLASHCARDS ARE SO USEFUL AND I LOVE THE SCHOOLGPT. IT ALSO IS LITREALLY LIKE CHATGPT BUT SMARTER!! HELPED ME WITH MY MASCARA PROBLEMS TOO!! AS WELL AS MY REAL SUBJECTS ! DUHHH 😍😁😲🤑💗✨🎀😮
Elisha
iOS user
This app is phenomenal down to the correct info and the various topics you can study! I greatly recommend it for people who struggle with procrastination and those who need homework help. It has been perfectly accurate for world 1 history as far as I’ve seen! Geometry too!
Paul T
iOS user
The app is very easy to use and well designed. I have found everything I was looking for so far and have been able to learn a lot from the presentations! I will definitely use the app for a class assignment! And of course it also helps a lot as an inspiration.
Stefan S
iOS user
This app is really great. There are so many study notes and help [...]. My problem subject is French, for example, and the app has so many options for help. Thanks to this app, I have improved my French. I would recommend it to anyone.
Samantha Klich
Android user
Wow, I am really amazed. I just tried the app because I've seen it advertised many times and was absolutely stunned. This app is THE HELP you want for school and above all, it offers so many things, such as workouts and fact sheets, which have been VERY helpful to me personally.
Anna
iOS user
I think it’s very much worth it and you’ll end up using it a lot once you get the hang of it and even after looking at others notes you can still ask your Artificial intelligence buddy the question and ask to simplify it if you still don’t get it!!! In the end I think it’s worth it 😊👍 ⚠️Also DID I MENTION ITS FREEE YOU DON’T HAVE TO PAY FOR ANYTHING AND STILL GET YOUR GRADES IN PERFECTLY❗️❗️⚠️
Thomas R
iOS user
Knowunity is the BEST app I’ve used in a minute. This is not an ai review or anything this is genuinely coming from a 7th grade student (I know 2011 im young) but dude this app is a 10/10 i have maintained a 3.8 gpa and have plenty of time for gaming. I love it and my mom is just happy I got good grades
Brad T
Android user
Not only did it help me find the answer but it also showed me alternative ways to solve it. I was horrible in math and science but now I have an a in both subjects. Thanks for the help🤍🤍
David K
iOS user
The app's just great! All I have to do is enter the topic in the search bar and I get the response real fast. I don't have to watch 10 YouTube videos to understand something, so I'm saving my time. Highly recommended!
Sudenaz Ocak
Android user
In school I was really bad at maths but thanks to the app, I am doing better now. I am so grateful that you made the app.
Greenlight Bonnie
Android user
I found this app a couple years ago and it has only gotten better since then. I really love it because it can help with written questions and photo questions. Also, it can find study guides that other people have made as well as flashcard sets and practice tests. The free version is also amazing for students who might not be able to afford it. Would 100% recommend
Aubrey
iOS user
Best app if you're in Highschool or Junior high. I have been using this app for 2 school years and it's the best, it's good if you don't have anyone to help you with school work.😋🩷🎀
Marco B
iOS user
THE QUIZES AND FLASHCARDS ARE SO USEFUL AND I LOVE THE SCHOOLGPT. IT ALSO IS LITREALLY LIKE CHATGPT BUT SMARTER!! HELPED ME WITH MY MASCARA PROBLEMS TOO!! AS WELL AS MY REAL SUBJECTS ! DUHHH 😍😁😲🤑💗✨🎀😮
Elisha
iOS user
This app is phenomenal down to the correct info and the various topics you can study! I greatly recommend it for people who struggle with procrastination and those who need homework help. It has been perfectly accurate for world 1 history as far as I’ve seen! Geometry too!
Paul T
iOS user