Trigonometry connects angles and ratios in right triangles, giving us...
Understanding Trigonometric Functions: Basics and Graphs
Gabriella Mulé@bellamule08


1 / 5
1
of 5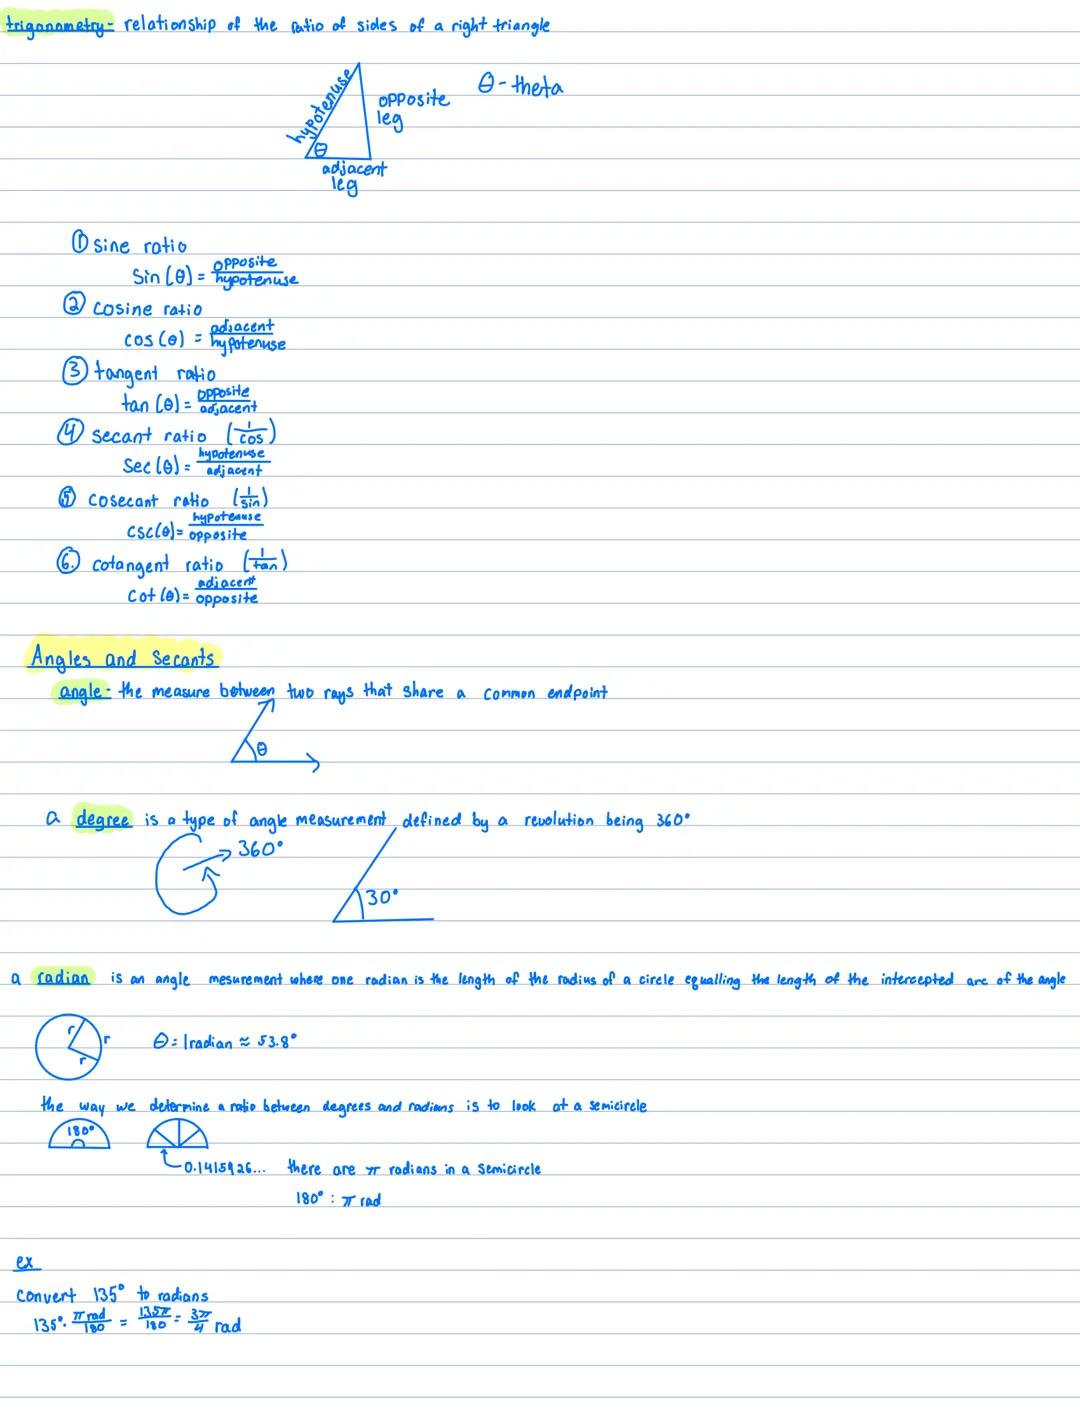
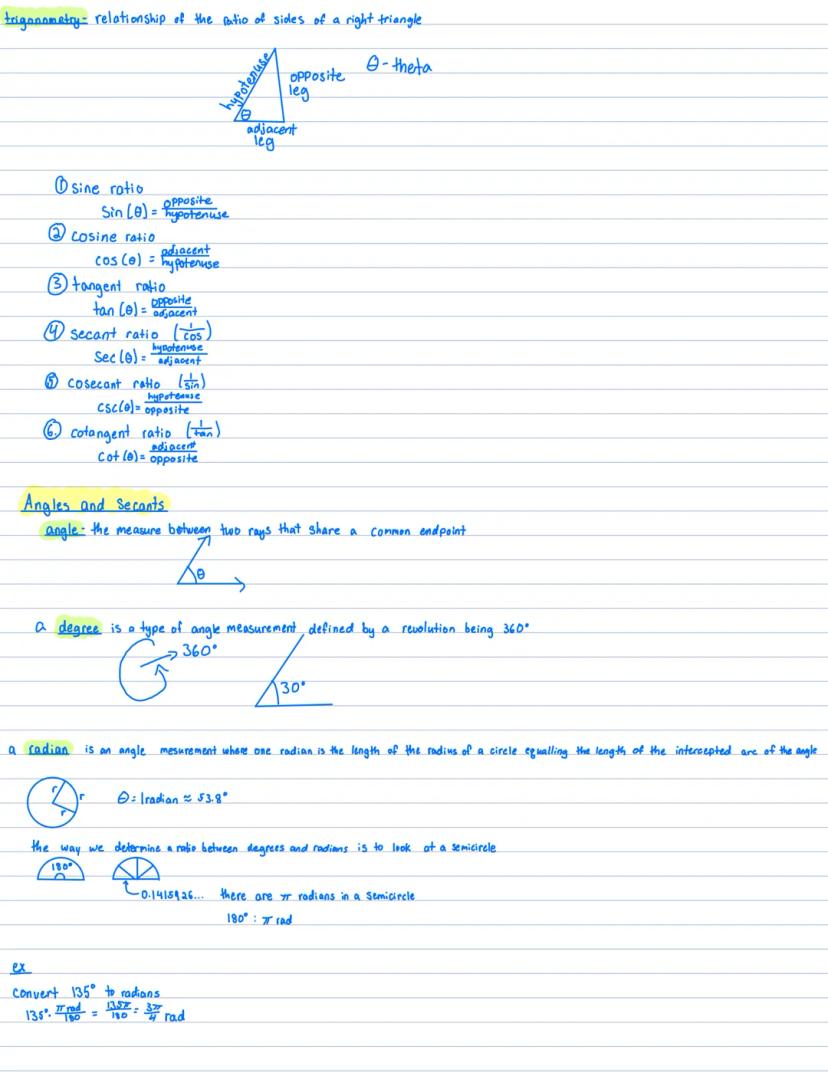
Trigonometric Ratios
Trigonometry is all about the relationship between angles and the sides of a right triangle. There are six key ratios to remember:
- Sine (sin) = opposite/hypotenuse
- Cosine (cos) = adjacent/hypotenuse
- Tangent (tan) = opposite/adjacent
- Secant (sec) = hypotenuse/adjacent (reciprocal of cosine)
- Cosecant (csc) = hypotenuse/opposite (reciprocal of sine)
- Cotangent (cot) = adjacent/opposite (reciprocal of tangent)
Angles can be measured in degrees or radians. Degrees are familiar - a full circle equals 360°. Radians are based on the radius of a circle, with a full circle equal to 2π radians (about 6.28). To convert between them:
- Degrees to radians: multiply by π/180
- Radians to degrees: multiply by 180/π
💡 A quick conversion shortcut: 180° equals π radians, so 90° equals π/2 radians, 60° equals π/3 radians, etc.
For example, to convert 135° to radians, you calculate: (135° × π)/180 = 3π/4 radians.
2
of 5
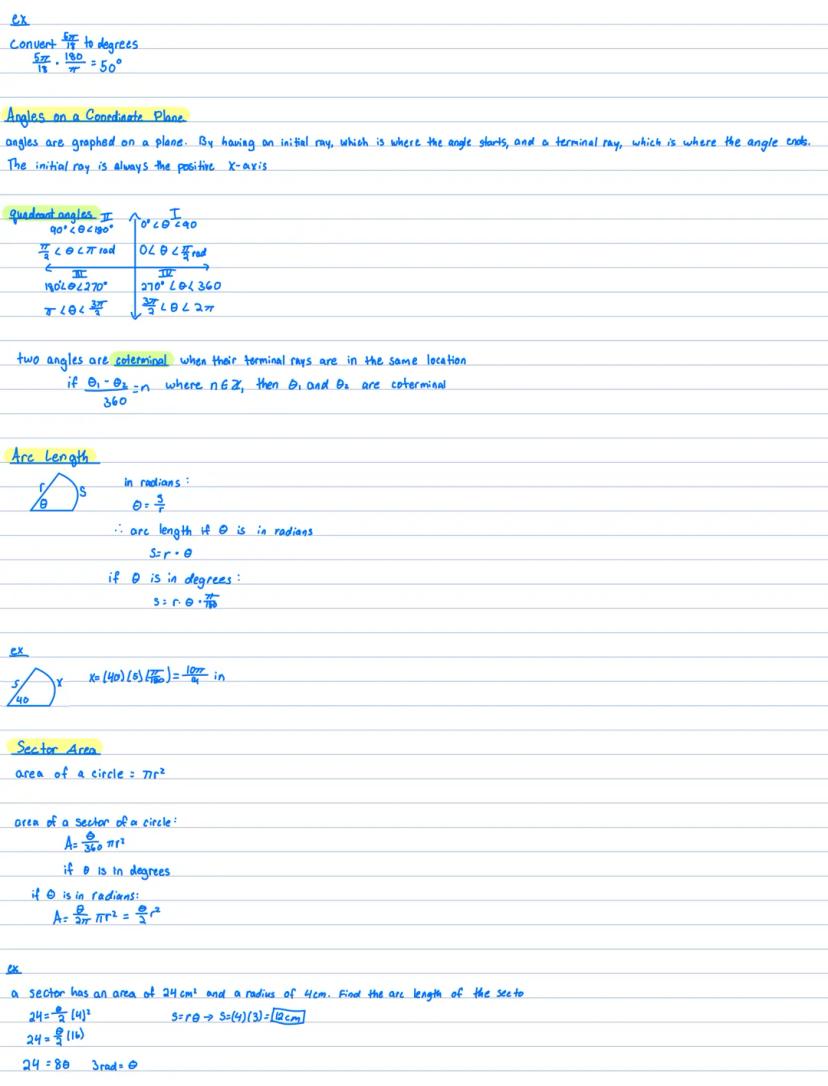
Angles on the Coordinate Plane
When graphing angles on a coordinate plane, you always start with the initial ray on the positive x-axis. The angle opens counterclockwise for positive angles and clockwise for negative ones.
The coordinate plane has four quadrants, each with unique angle ranges:
- Quadrant I: 0° to 90° (0 to π/2 radians)
- Quadrant II: 90° to 180° (π/2 to π radians)
- Quadrant III: 180° to 270° (π to 3π/2 radians)
- Quadrant IV: 270° to 360° (3π/2 to 2π radians)
Coterminal angles have the same terminal rays. If two angles differ by a multiple of 360° (or 2π radians), they're coterminal.
Arc Length and Sector Area
When an angle opens in a circle, it creates an arc and a sector. The formulas to remember:
Arc length with radius and angle θ:
- In radians: s = r × θ
- In degrees: s = r × θ ×
Sector area with radius and angle θ:
- In radians: A = (θ × r²)/2
- In degrees: A = × π × r²
🔍 Using radians makes the formulas simpler! That's why mathematicians and physicists prefer radians over degrees.
3
of 5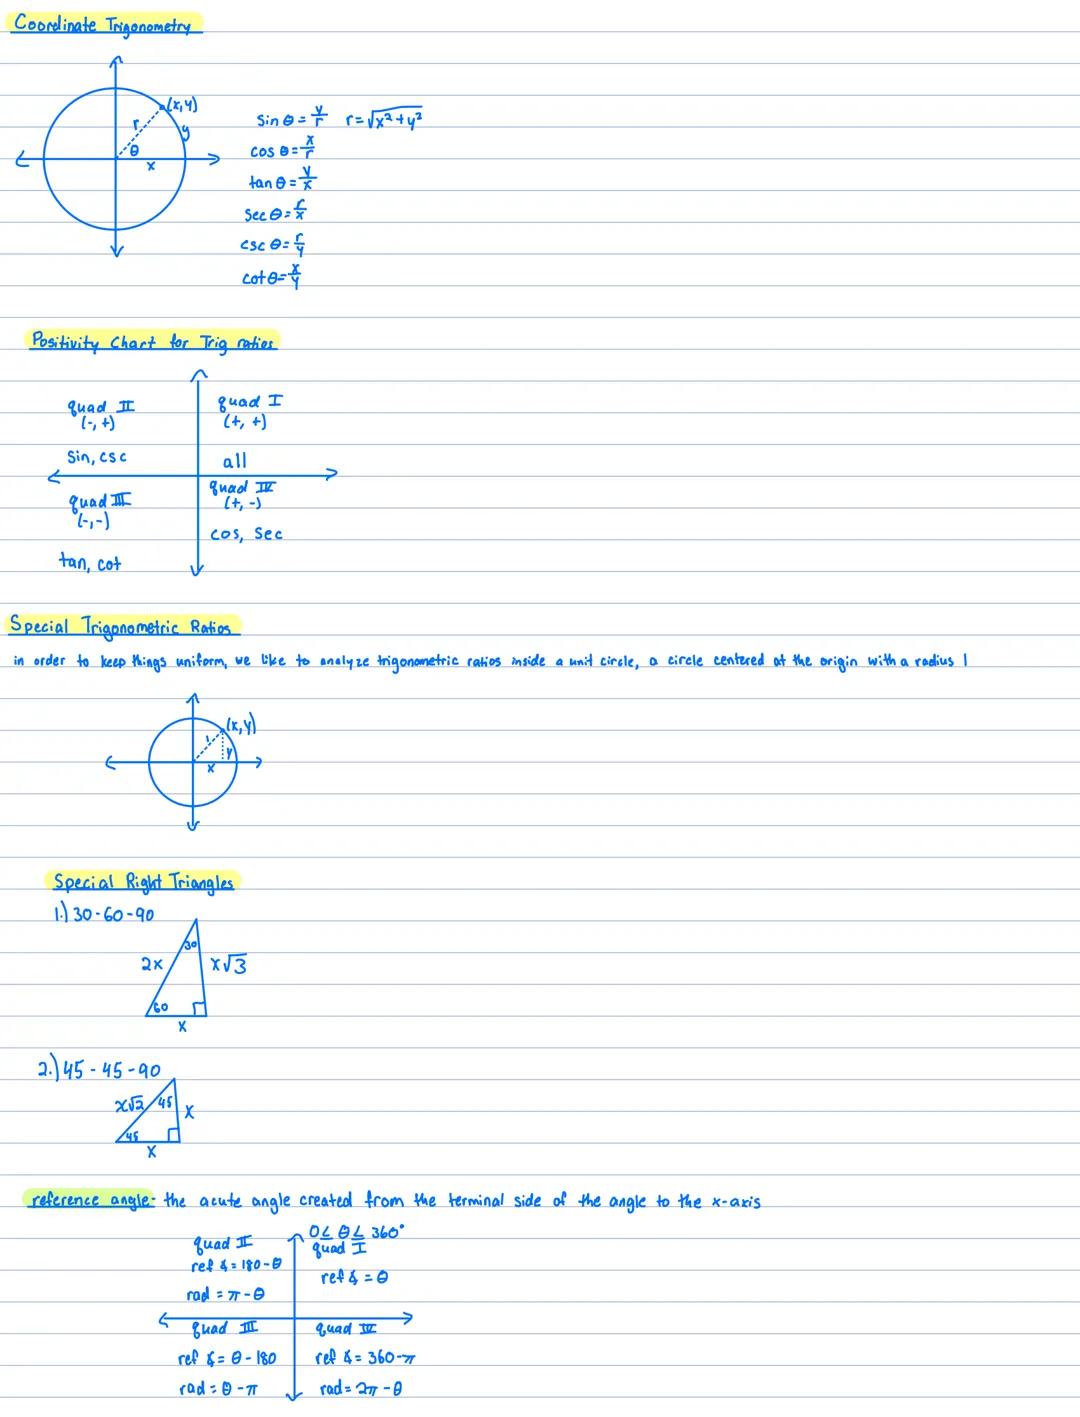
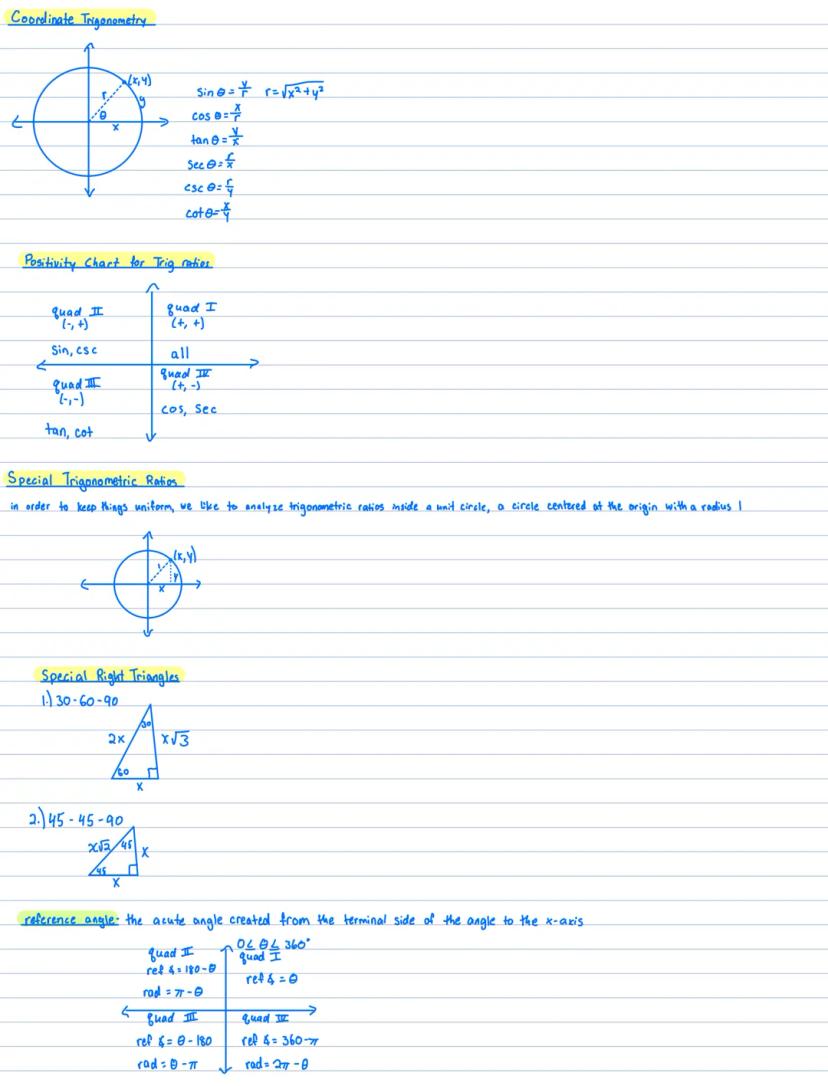
Coordinate Trigonometry and Positivity
In the coordinate plane, the trigonometric functions work for any angle, not just in right triangles. Each quadrant has different positive and negative values:
- Quadrant I : All trig functions are positive
- Quadrant II : Only sine and cosecant are positive
- Quadrant III : Only tangent and cotangent are positive
- Quadrant IV : Only cosine and secant are positive
A helpful memory trick: "All Students Take Calculus" - moving clockwise from Quadrant I: All, Sine, Tangent, Cosine.
Special Angles and Triangles
The unit circle (radius = 1) helps us find exact values for trig functions. Two special right triangles are particularly useful:
-
30°-60°-90° triangle: If the shortest leg is x, then the other leg is x√3 and the hypotenuse is 2x.
-
45°-45°-90° triangle: Both legs are equal , and the hypotenuse is x√2.
The reference angle is the acute angle formed between the terminal side of an angle and the x-axis. It helps find trig values for angles in any quadrant.
🧠 Understanding the unit circle is like having a cheat sheet for trigonometry! It connects coordinate geometry with trigonometric values.
4
of 5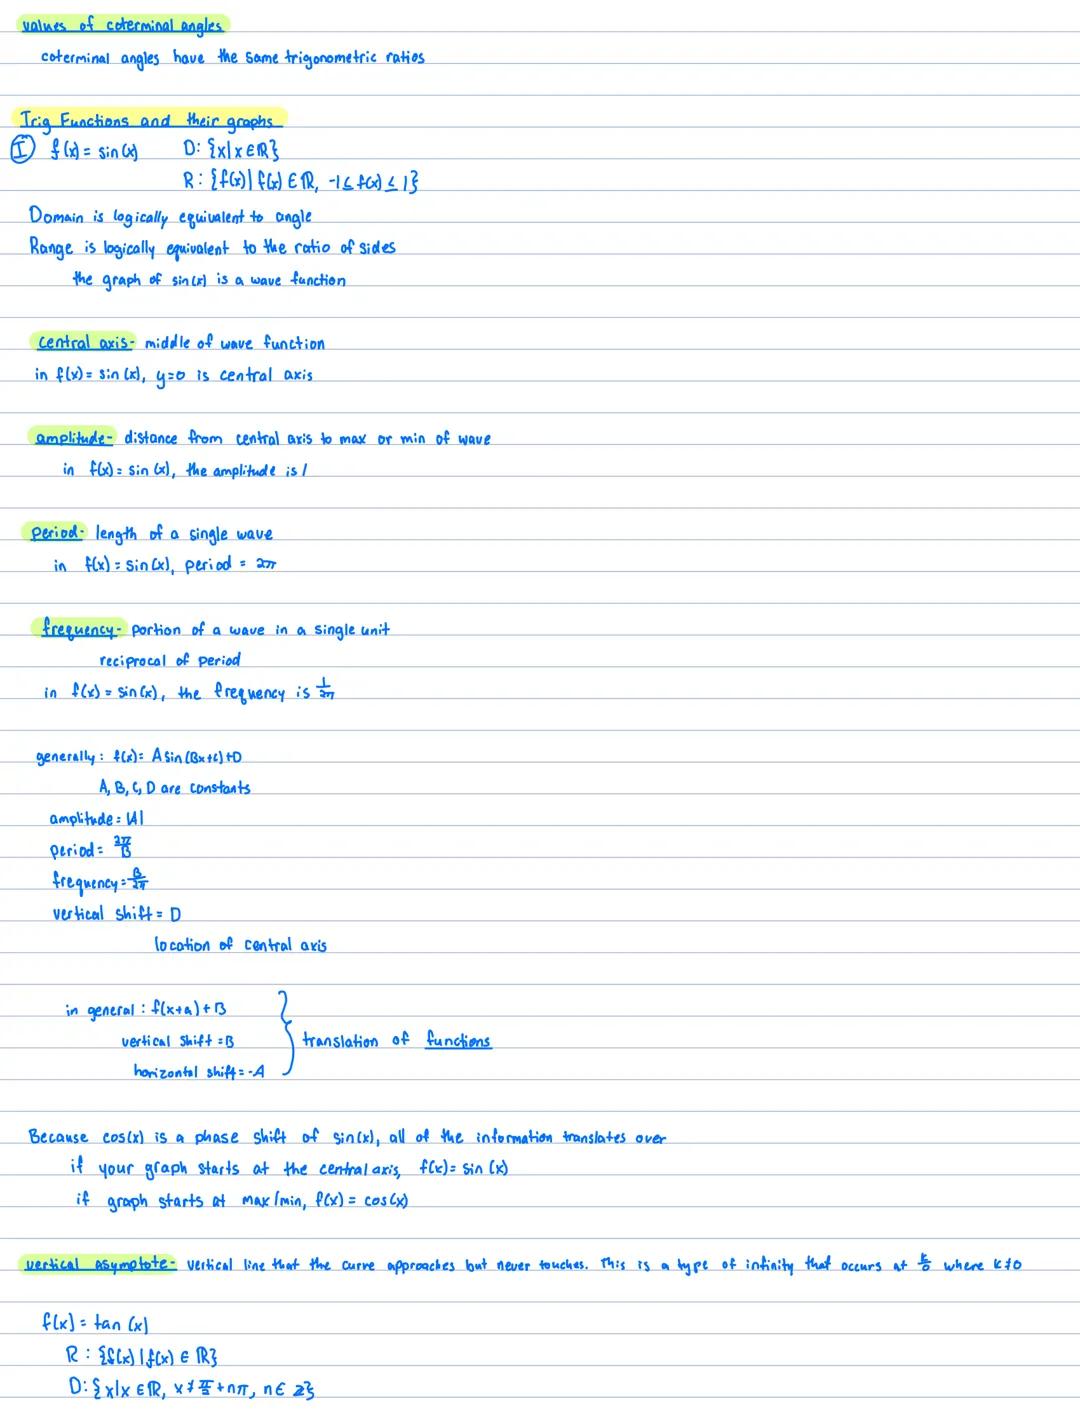
Trigonometric Functions and Their Graphs
Trig functions create distinctive wave patterns when graphed. The sine function, f = sin, has these key characteristics:
- Domain: All real numbers
- Range: Values between -1 and 1
- Central axis: y = 0 (the middle line of the wave)
- Amplitude: 1 (distance from central axis to peak)
- Period: 2π (length of one complete cycle)
- Frequency: 1/(2π) (cycles per unit)
For the general form f = A·sin+D:
- |A| is the amplitude
- 2π/B is the period
- D shifts the function vertically
Cosine graphs are similar to sine graphs but shifted horizontally. If a graph starts at its middle value, it's a sine function. If it starts at a maximum or minimum, it's a cosine function.
Tangent, cotangent, secant, and cosecant have different graphs with vertical asymptotes - vertical lines the graphs approach but never touch. For example, tan has asymptotes at x = π/2 + nπ (where n is any integer).
🌊 Think of sine and cosine as smooth ocean waves, while tangent and the other functions are like mathematical tsunamis that shoot toward infinity!
5
of 5
Other Trigonometric Function Graphs
The remaining trig functions have unique graphing characteristics:
Cotangent function f = cot:
- Domain: All real numbers except x = nπ (where n is any integer)
- Range: All real numbers
- Has vertical asymptotes at x = nπ
- Period of π
Secant function f = sec:
- Domain: All real numbers except x = + nπ
- Range: Values less than or equal to -1 or greater than or equal to 1
- Has vertical asymptotes at x = + nπ
- Period of 2π
Cosecant function f = csc:
- Domain: All real numbers except x = nπ
- Range: Values less than or equal to -1 or greater than or equal to 1
- Has vertical asymptotes at x = nπ
- Period of 2π
📊 Notice how secant is related to cosine, and cosecant is related to sine! Sec = 1/cos and csc = 1/sin, which explains their similar periods but different asymptotes.
We thought you’d never ask...
Our AI companion is specifically built for the needs of students. Based on the millions of content pieces we have on the platform we can provide truly meaningful and relevant answers to students. But its not only about answers, the companion is even more about guiding students through their daily learning challenges, with personalised study plans, quizzes or content pieces in the chat and 100% personalisation based on the students skills and developments.
You can download the app in the Google Play Store and in the Apple App Store.
That's right! Enjoy free access to study content, connect with fellow students, and get instant help – all at your fingertips.
Similar Content
Most popular content: Trigonometric Functions
1Most popular content in Calculus 1
9Basic Formulas in Algebra, Geometry, Trigonometry and Calculus
This includes formulas for algebra, analytic geometry, soldi geometry, integral calculus, differential calculus and statistics and probability.
12th2,460119
10:4 Inscribed Angles
This is a finished and completed worksheet that applies very helpful information for the subject.
10th2,66627
Congruent Chords & Arcs
This is a finished and completed worksheet that applies very helpful information for the subject.
10th9052
Quiz 10-1: Intro to Circes, Central Angles, Arcs, and Chords
This is a finished and completed worksheet that applies very helpful information for the subject.
10th1,0899
Unit 7: Right Triangles & Trigonometry Homework 5: Trigonometry: Finding Sides And Angles
Geometry Homework, 100%
10th2,87717
Central Angles & Arc Measures
This is a finished and completed worksheet that applies very helpful information for the subject.
10th3083
Mathematics (Solid Mensuration)
This note is all about solid mensuration, angles, and polygons. It includes formulas and sample problems with solution.
3113
Unit 7: Right Triangles & Trigonometry Homework 1: Pythagorean Theorem and its Converse
Geometry Homework, 100%
10th1,2943
The Sine Law
Notes and word problems/questions about the topic
731
Most popular content
9O
Origins and Dynamics of the Columbian Exchange
Analyze the ecological and economic motivations behind the initial transfer of goods, people, and diseases between the Old and New Worlds.
9th3,1280
I
Introduction to Early Cultural Interactions
Analyze the initial social and religious encounters between Europeans, Africans, and Indigenous peoples in the colonial Americas.
9th2,7730
O
Origins of Ancient River Civilizations
Analyze the environmental factors and technological innovations that led to the rise of early states in Mesopotamia, Egypt, and the Indus Valley.
9th3,1870
M
Motivations for European Exploration
Analyze the economic, religious, and political factors that drove European powers to the Americas during the 15th and 16th centuries.
9th1,7780
F
Foundations of Ethical Guidelines in Research
Practice the core principles of the APA ethical code including informed consent, debriefing, and the role of Institutional Review Boards.
9th1,3360
I
Introduction to Native American Societies
Examine the diverse social, political, and economic structures of North American indigenous groups prior to European contact.
9th1,1100
I
Introduction to the Spanish Encomienda System
Explore the fundamental economic and social structures of the Spanish colonial system, focusing on the encomienda and the casta social hierarchy.
9th8890
I
Introduction to Biological Elements of Life
Practice identifying the essential elements including carbon, nitrogen, phosphorus, and sulfur that compose biological macromolecules.
9th1,7410
O
Origins of the Articles of Confederation
Practice identifying the motivations for a weak central government and the specific powers granted to the states under the first U.S. constitution.
9th9370
Students love us — and so will you.
4.6/5App Store
4.7/5Google Play
The app is very easy to use and well designed. I have found everything I was looking for so far and have been able to learn a lot from the presentations! I will definitely use the app for a class assignment! And of course it also helps a lot as an inspiration.
Stefan SiOS user
This app is really great. There are so many study notes and help [...]. My problem subject is French, for example, and the app has so many options for help. Thanks to this app, I have improved my French. I would recommend it to anyone.
Samantha KlichAndroid user
Wow, I am really amazed. I just tried the app because I've seen it advertised many times and was absolutely stunned. This app is THE HELP you want for school and above all, it offers so many things, such as workouts and fact sheets, which have been VERY helpful to me personally.
AnnaiOS user
Understanding Trigonometric Functions: Basics and Graphs
Gabriella Mulé@bellamule08
Trigonometry connects angles and ratios in right triangles, giving us powerful tools to solve real-world problems. Understanding these relationships helps you calculate distances, heights, and angles that would be impossible to measure directly.
1
of 5
Sign up to see the content. It's free!
- Access to all documents
- Improve your grades
- Join milions of students
Trigonometric Ratios
Trigonometry is all about the relationship between angles and the sides of a right triangle. There are six key ratios to remember:
- Sine (sin) = opposite/hypotenuse
- Cosine (cos) = adjacent/hypotenuse
- Tangent (tan) = opposite/adjacent
- Secant (sec) = hypotenuse/adjacent (reciprocal of cosine)
- Cosecant (csc) = hypotenuse/opposite (reciprocal of sine)
- Cotangent (cot) = adjacent/opposite (reciprocal of tangent)
Angles can be measured in degrees or radians. Degrees are familiar - a full circle equals 360°. Radians are based on the radius of a circle, with a full circle equal to 2π radians (about 6.28). To convert between them:
- Degrees to radians: multiply by π/180
- Radians to degrees: multiply by 180/π
💡 A quick conversion shortcut: 180° equals π radians, so 90° equals π/2 radians, 60° equals π/3 radians, etc.
For example, to convert 135° to radians, you calculate: (135° × π)/180 = 3π/4 radians.
2
of 5Sign up to see the content. It's free!
- Access to all documents
- Improve your grades
- Join milions of students
Angles on the Coordinate Plane
When graphing angles on a coordinate plane, you always start with the initial ray on the positive x-axis. The angle opens counterclockwise for positive angles and clockwise for negative ones.
The coordinate plane has four quadrants, each with unique angle ranges:
- Quadrant I: 0° to 90° (0 to π/2 radians)
- Quadrant II: 90° to 180° (π/2 to π radians)
- Quadrant III: 180° to 270° (π to 3π/2 radians)
- Quadrant IV: 270° to 360° (3π/2 to 2π radians)
Coterminal angles have the same terminal rays. If two angles differ by a multiple of 360° (or 2π radians), they're coterminal.
Arc Length and Sector Area
When an angle opens in a circle, it creates an arc and a sector. The formulas to remember:
Arc length with radius and angle θ:
- In radians: s = r × θ
- In degrees: s = r × θ ×
Sector area with radius and angle θ:
- In radians: A = (θ × r²)/2
- In degrees: A = × π × r²
🔍 Using radians makes the formulas simpler! That's why mathematicians and physicists prefer radians over degrees.
3
of 5Sign up to see the content. It's free!
- Access to all documents
- Improve your grades
- Join milions of students
Coordinate Trigonometry and Positivity
In the coordinate plane, the trigonometric functions work for any angle, not just in right triangles. Each quadrant has different positive and negative values:
- Quadrant I : All trig functions are positive
- Quadrant II : Only sine and cosecant are positive
- Quadrant III : Only tangent and cotangent are positive
- Quadrant IV : Only cosine and secant are positive
A helpful memory trick: "All Students Take Calculus" - moving clockwise from Quadrant I: All, Sine, Tangent, Cosine.
Special Angles and Triangles
The unit circle (radius = 1) helps us find exact values for trig functions. Two special right triangles are particularly useful:
-
30°-60°-90° triangle: If the shortest leg is x, then the other leg is x√3 and the hypotenuse is 2x.
-
45°-45°-90° triangle: Both legs are equal , and the hypotenuse is x√2.
The reference angle is the acute angle formed between the terminal side of an angle and the x-axis. It helps find trig values for angles in any quadrant.
🧠 Understanding the unit circle is like having a cheat sheet for trigonometry! It connects coordinate geometry with trigonometric values.
4
of 5Sign up to see the content. It's free!
- Access to all documents
- Improve your grades
- Join milions of students
Trigonometric Functions and Their Graphs
Trig functions create distinctive wave patterns when graphed. The sine function, f = sin, has these key characteristics:
- Domain: All real numbers
- Range: Values between -1 and 1
- Central axis: y = 0 (the middle line of the wave)
- Amplitude: 1 (distance from central axis to peak)
- Period: 2π (length of one complete cycle)
- Frequency: 1/(2π) (cycles per unit)
For the general form f = A·sin+D:
- |A| is the amplitude
- 2π/B is the period
- D shifts the function vertically
Cosine graphs are similar to sine graphs but shifted horizontally. If a graph starts at its middle value, it's a sine function. If it starts at a maximum or minimum, it's a cosine function.
Tangent, cotangent, secant, and cosecant have different graphs with vertical asymptotes - vertical lines the graphs approach but never touch. For example, tan has asymptotes at x = π/2 + nπ (where n is any integer).
🌊 Think of sine and cosine as smooth ocean waves, while tangent and the other functions are like mathematical tsunamis that shoot toward infinity!
5
of 5Sign up to see the content. It's free!
- Access to all documents
- Improve your grades
- Join milions of students
Other Trigonometric Function Graphs
The remaining trig functions have unique graphing characteristics:
Cotangent function f = cot:
- Domain: All real numbers except x = nπ (where n is any integer)
- Range: All real numbers
- Has vertical asymptotes at x = nπ
- Period of π
Secant function f = sec:
- Domain: All real numbers except x = + nπ
- Range: Values less than or equal to -1 or greater than or equal to 1
- Has vertical asymptotes at x = + nπ
- Period of 2π
Cosecant function f = csc:
- Domain: All real numbers except x = nπ
- Range: Values less than or equal to -1 or greater than or equal to 1
- Has vertical asymptotes at x = nπ
- Period of 2π
📊 Notice how secant is related to cosine, and cosecant is related to sine! Sec = 1/cos and csc = 1/sin, which explains their similar periods but different asymptotes.
We thought you’d never ask...
Our AI companion is specifically built for the needs of students. Based on the millions of content pieces we have on the platform we can provide truly meaningful and relevant answers to students. But its not only about answers, the companion is even more about guiding students through their daily learning challenges, with personalised study plans, quizzes or content pieces in the chat and 100% personalisation based on the students skills and developments.
You can download the app in the Google Play Store and in the Apple App Store.
That's right! Enjoy free access to study content, connect with fellow students, and get instant help – all at your fingertips.
Similar Content
Most popular content: Trigonometric Functions
1Most popular content in Calculus 1
9Basic Formulas in Algebra, Geometry, Trigonometry and Calculus
This includes formulas for algebra, analytic geometry, soldi geometry, integral calculus, differential calculus and statistics and probability.
12th2,460119
10:4 Inscribed Angles
This is a finished and completed worksheet that applies very helpful information for the subject.
10th2,66627
Congruent Chords & Arcs
This is a finished and completed worksheet that applies very helpful information for the subject.
10th9052
Quiz 10-1: Intro to Circes, Central Angles, Arcs, and Chords
This is a finished and completed worksheet that applies very helpful information for the subject.
10th1,0899
Unit 7: Right Triangles & Trigonometry Homework 5: Trigonometry: Finding Sides And Angles
Geometry Homework, 100%
10th2,87717
Central Angles & Arc Measures
This is a finished and completed worksheet that applies very helpful information for the subject.
10th3083
Mathematics (Solid Mensuration)
This note is all about solid mensuration, angles, and polygons. It includes formulas and sample problems with solution.
3113
Unit 7: Right Triangles & Trigonometry Homework 1: Pythagorean Theorem and its Converse
Geometry Homework, 100%
10th1,2943
The Sine Law
Notes and word problems/questions about the topic
731
Most popular content
9O
Origins and Dynamics of the Columbian Exchange
Analyze the ecological and economic motivations behind the initial transfer of goods, people, and diseases between the Old and New Worlds.
9th3,1280
I
Introduction to Early Cultural Interactions
Analyze the initial social and religious encounters between Europeans, Africans, and Indigenous peoples in the colonial Americas.
9th2,7730
O
Origins of Ancient River Civilizations
Analyze the environmental factors and technological innovations that led to the rise of early states in Mesopotamia, Egypt, and the Indus Valley.
9th3,1870
M
Motivations for European Exploration
Analyze the economic, religious, and political factors that drove European powers to the Americas during the 15th and 16th centuries.
9th1,7780
F
Foundations of Ethical Guidelines in Research
Practice the core principles of the APA ethical code including informed consent, debriefing, and the role of Institutional Review Boards.
9th1,3360
I
Introduction to Native American Societies
Examine the diverse social, political, and economic structures of North American indigenous groups prior to European contact.
9th1,1100
I
Introduction to the Spanish Encomienda System
Explore the fundamental economic and social structures of the Spanish colonial system, focusing on the encomienda and the casta social hierarchy.
9th8890
I
Introduction to Biological Elements of Life
Practice identifying the essential elements including carbon, nitrogen, phosphorus, and sulfur that compose biological macromolecules.
9th1,7410
O
Origins of the Articles of Confederation
Practice identifying the motivations for a weak central government and the specific powers granted to the states under the first U.S. constitution.
9th9370
Students love us — and so will you.
4.6/5App Store
4.7/5Google Play
The app is very easy to use and well designed. I have found everything I was looking for so far and have been able to learn a lot from the presentations! I will definitely use the app for a class assignment! And of course it also helps a lot as an inspiration.
Stefan SiOS user
This app is really great. There are so many study notes and help [...]. My problem subject is French, for example, and the app has so many options for help. Thanks to this app, I have improved my French. I would recommend it to anyone.
Samantha KlichAndroid user
Wow, I am really amazed. I just tried the app because I've seen it advertised many times and was absolutely stunned. This app is THE HELP you want for school and above all, it offers so many things, such as workouts and fact sheets, which have been VERY helpful to me personally.
AnnaiOS user