Data analysis is all about making sense of information collected...
Understanding Data and Data Analysis
1 / 5
1
of 5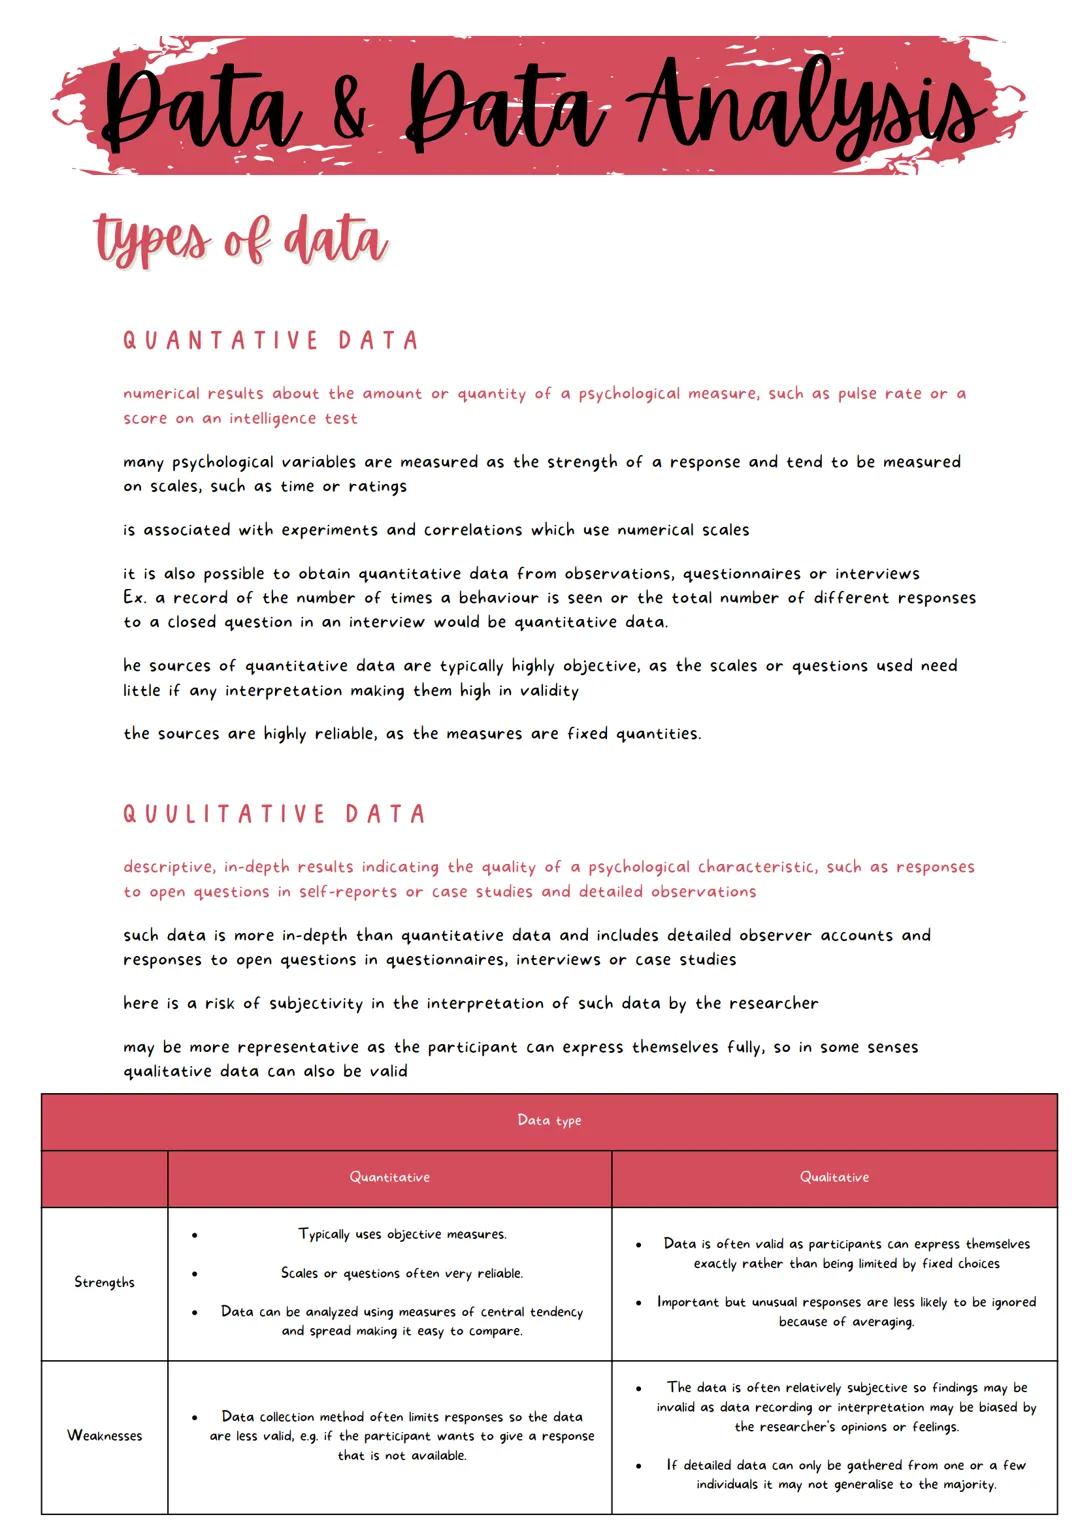
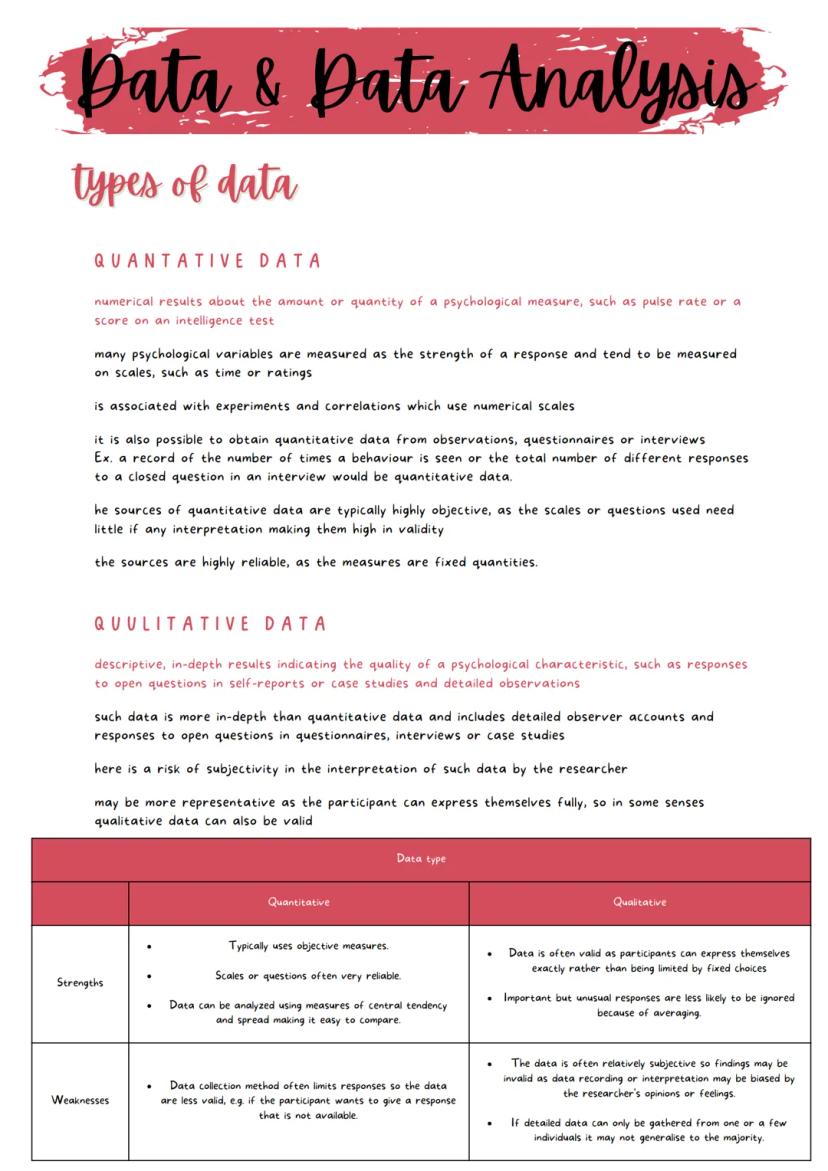
Types of Data in Psychology
Ever wondered why some psychological studies use numbers while others use detailed descriptions? That's because researchers use two main types of data: quantitative and qualitative.
Quantitative data consists of numerical measurements like pulse rates or test scores. This type of data works well with experiments and correlational studies because it's objective and reliable. For example, counting how many times a behavior occurs or recording responses on a numerical scale requires little interpretation, making the data highly valid.
Qualitative data provides descriptive, in-depth information about psychological characteristics. Think of detailed observations or responses to open-ended questions in interviews. This type of data allows participants to express themselves fully without being limited to fixed choices, often making it more representative of real experiences.
Quick Comparison: Quantitative data is great for statistical analysis and objective comparison, while qualitative data captures rich details and unique perspectives that might get lost in numbers alone.
Each type has its strengths and weaknesses. Quantitative data is objective and reliable but might miss important details. Qualitative data provides depth but can be more subjective and difficult to generalize from small samples.
2
of 5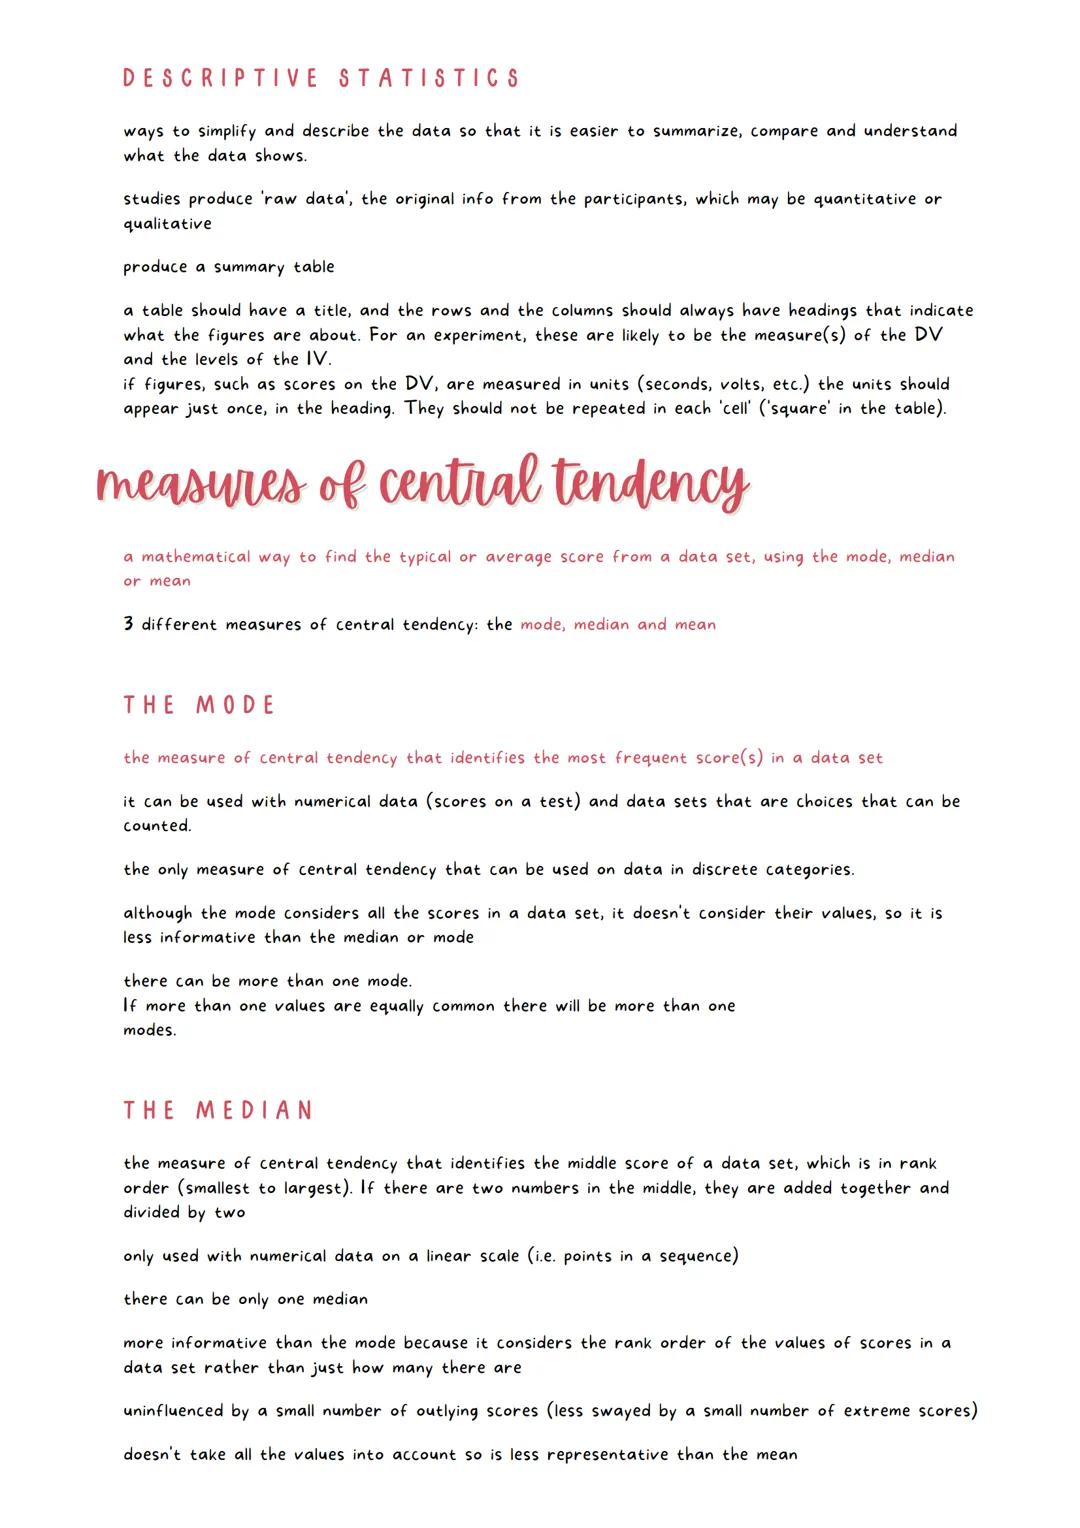
Descriptive Statistics
Raw data from studies can be overwhelming! Descriptive statistics help us simplify and understand what the information actually means.
When organizing data, start with a summary table that includes a clear title and labeled rows and columns. For experimental data, these typically show the dependent variable measurements and the independent variable levels. Remember that units of measurement (like seconds) should appear once in the heading, not repeated in every cell.
Measures of central tendency help us find the "typical" score in a dataset. The mode is simply the most frequent score and works with any type of data, including categories. While easy to calculate, it doesn't consider the actual values of scores. The median identifies the middle score when data is arranged from smallest to largest. It's more informative than the mode and isn't easily influenced by extreme scores.
Pro Tip: When choosing between measures of central tendency, consider what you need to know. The mode works for categorical data, the median handles outliers well, and the mean gives you the mathematical average.
Both the mode and median have limitations. The mode can have multiple values if several scores occur equally often. The median, while resistant to outliers, doesn't take all score values into account like the mean does.
3
of 5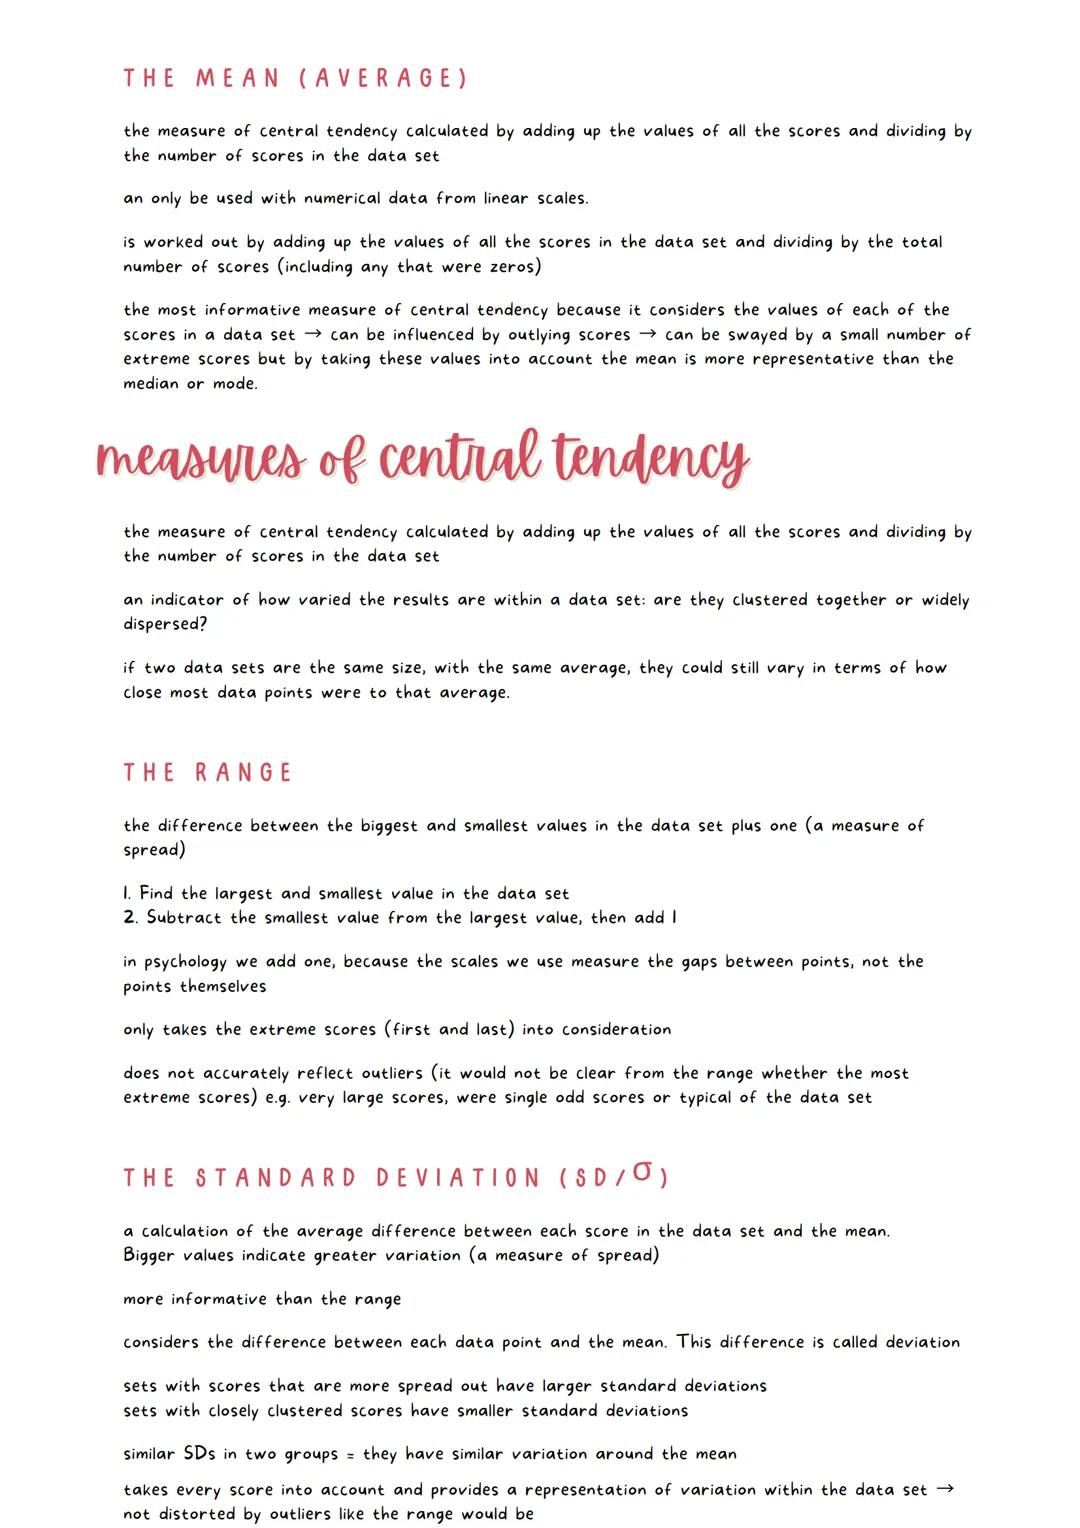
The Mean and Measures of Spread
The mean (average) is calculated by adding all scores and dividing by the number of scores. It's the most informative measure of central tendency because it uses every score's actual value. The mean works only with numerical data on linear scales but gives a more complete picture than the mode or median.
Understanding how spread out your data is matters just as much as knowing the average. Measures of spread show whether scores cluster tightly around the average or vary widely. Two datasets can have identical means but completely different distributions!
The range is the simplest spread measure—just subtract the smallest value from the largest and add one. In psychology, we add one because we're measuring the gaps between points. While easy to calculate, the range only considers extreme values and doesn't tell you whether outliers are typical or unusual.
The standard deviation (SD) calculates the average difference between each score and the mean. It's more informative than the range because it considers every data point. A larger SD indicates greater variation in scores. When comparing groups, similar SDs suggest similar variation patterns. Unlike the range, the standard deviation isn't easily distorted by a few extreme scores.
Remember This: When data points cluster closely around the mean, the standard deviation is small. When scores are widely spread out, the SD is large.
4
of 5
Visual Data Representation: Bar Charts and Histograms
Graphs make data patterns immediately visible in ways that tables of numbers can't. Different types of graphs serve different purposes.
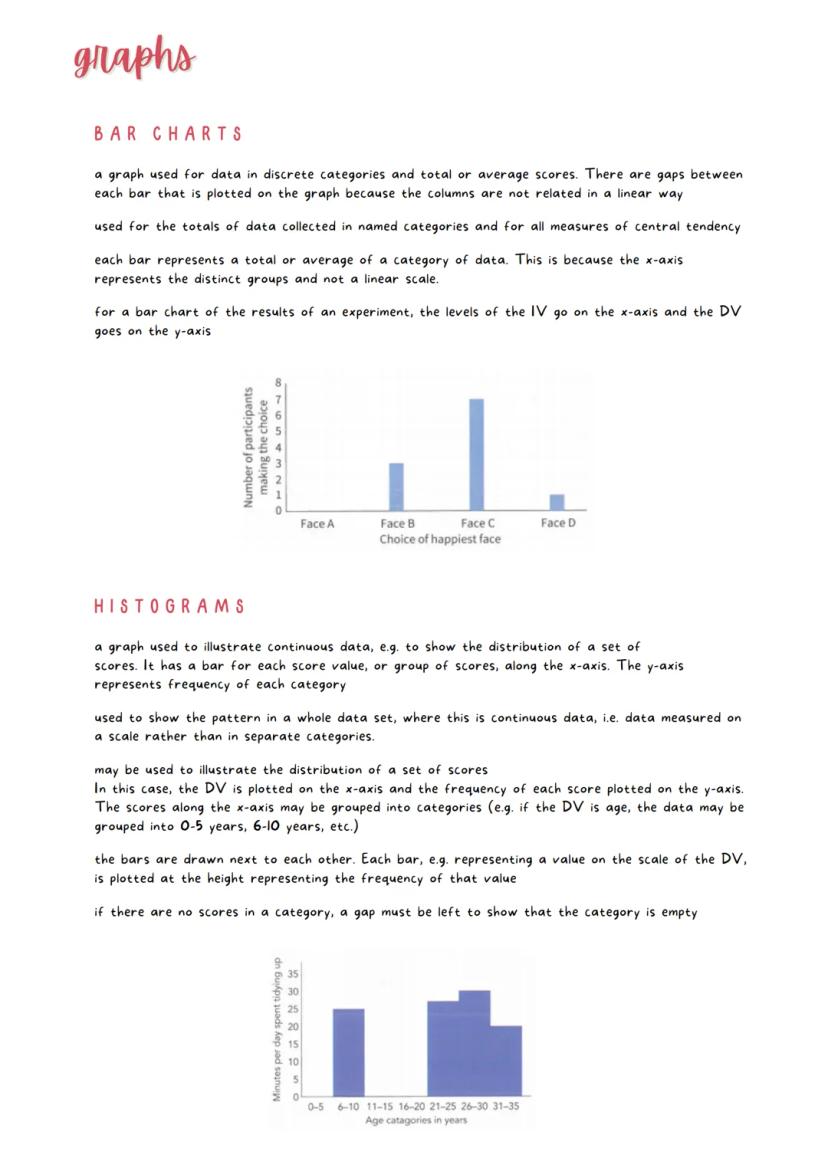
Bar charts work best for data in discrete categories or when showing averages. The spaces between bars indicate that categories aren't related in a continuous way. When displaying experimental results in a bar chart, put the independent variable (IV) levels on the x-axis and the dependent variable (DV) measurements on the y-axis. Each bar represents either a total or an average for a category.
Histograms display continuous data and show how scores are distributed across a range. Unlike bar charts, histogram bars touch each other because they represent adjacent points on a continuous scale. The x-axis shows the DV values (often grouped into ranges like "ages 6-10"), while the y-axis shows how frequently each value occurs. If no scores fall within a particular range, you must leave a gap to show the empty category.
Visual Tip: Not sure whether to use a bar chart or histogram? Ask yourself if your data falls into distinct categories (bar chart) or represents points along a continuous scale (histogram).
Histograms are particularly useful for seeing the overall shape of your data distribution—whether it's normally distributed (bell curve), skewed to one side, or has multiple peaks.
5
of 5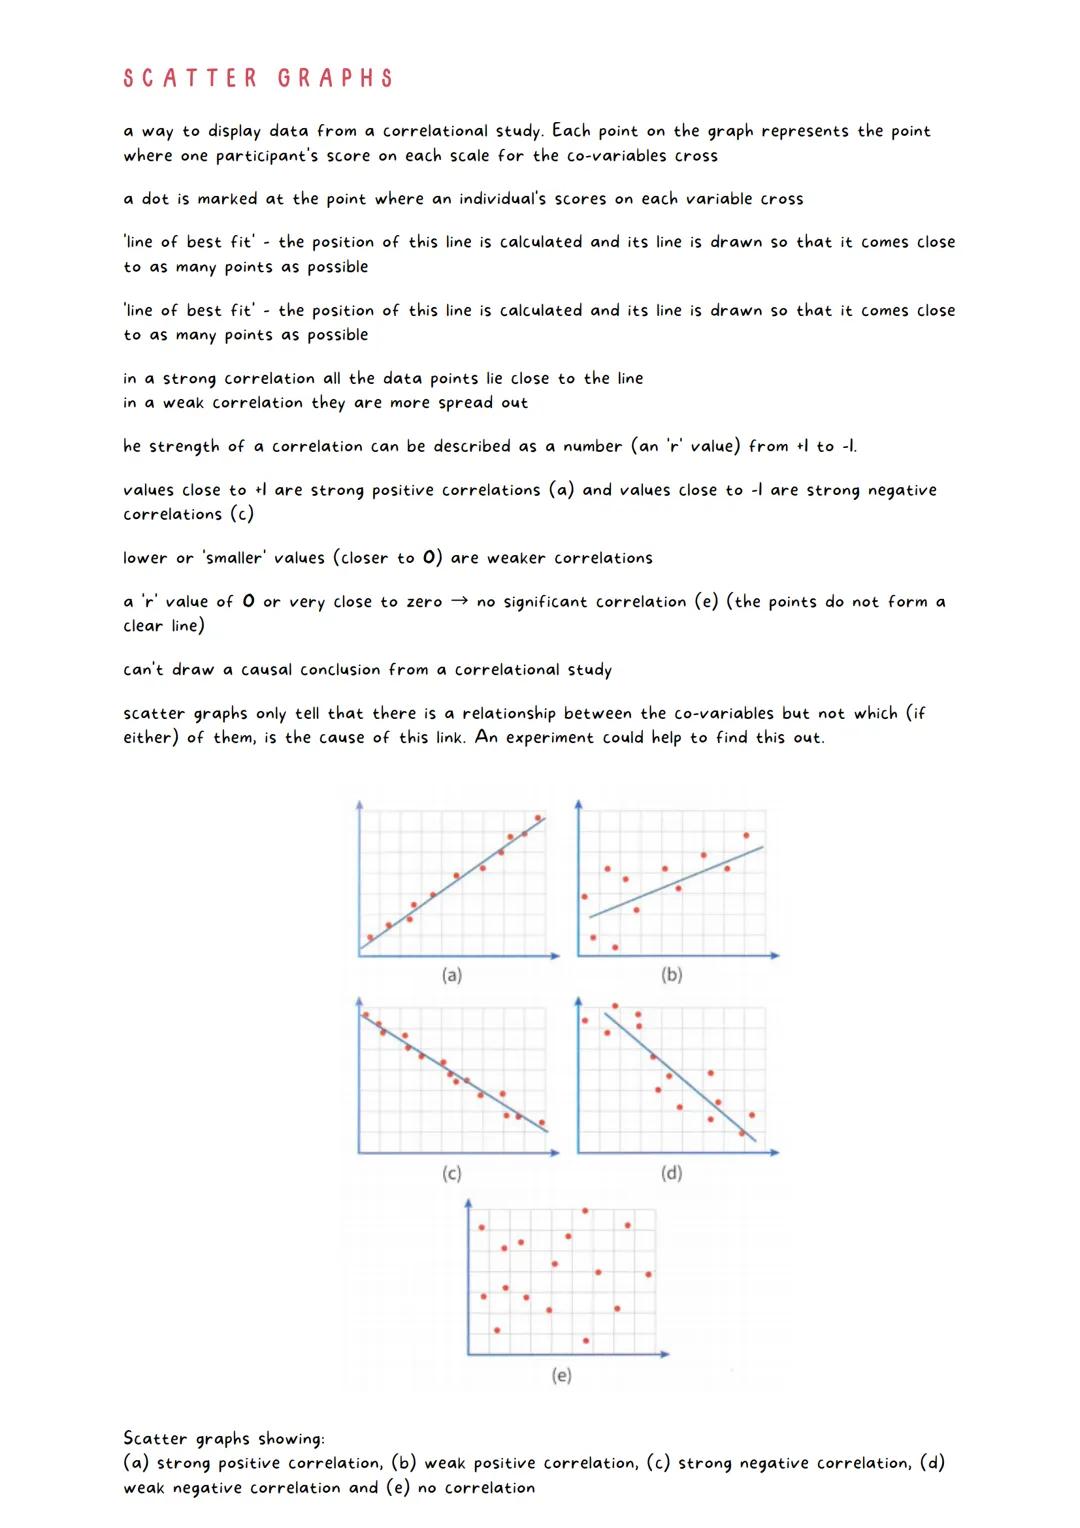
Scatter Graphs and Correlation
When studying relationships between two variables, scatter graphs are your best visual tool. Each dot represents one participant's scores on both variables.
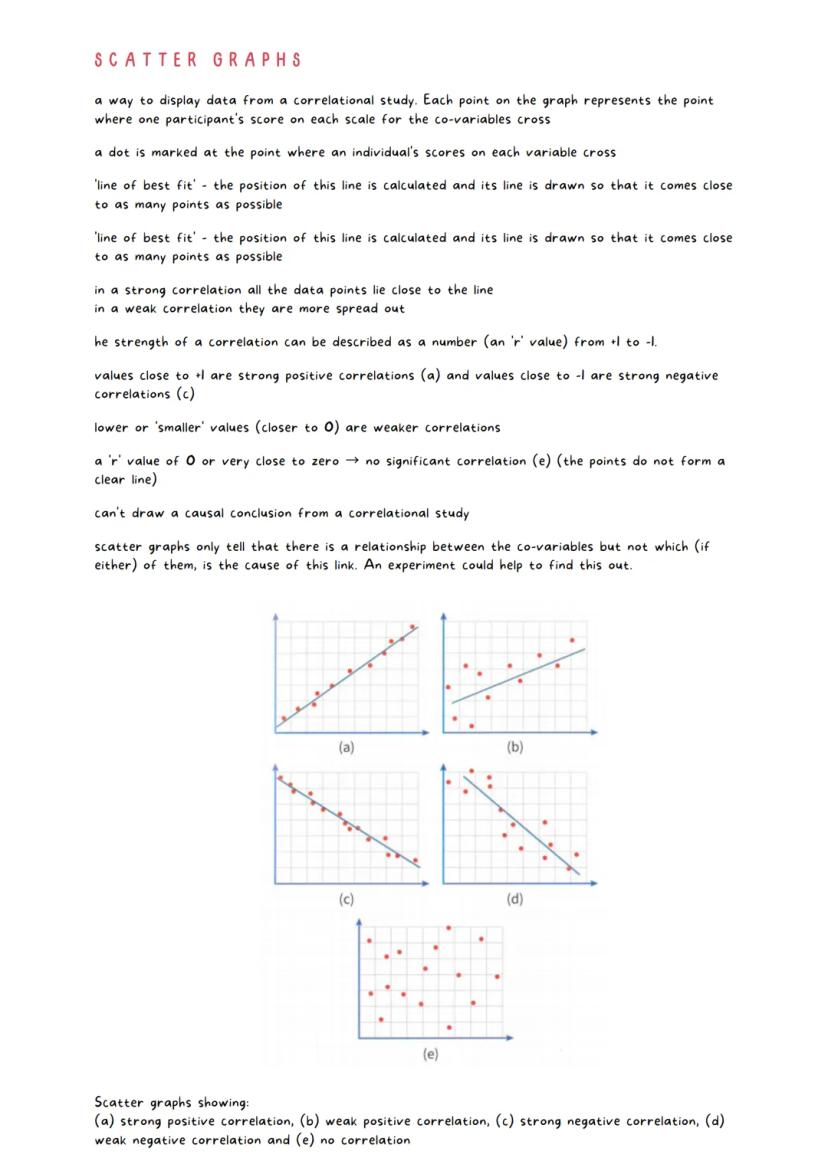
In a scatter graph, patterns tell the story. If dots form an upward sloping pattern, there's a positive correlation—as one variable increases, so does the other. A downward slope shows a negative correlation—as one variable increases, the other decreases. When dots spread randomly with no clear pattern, there's likely no correlation.
The line of best fit draws through the cloud of dots to show the general trend. In strong correlations, dots cluster tightly near this line; in weak correlations, they're more scattered. Correlation strength is measured as an "r value" ranging from +1 (perfect positive) to -1 (perfect negative), with values near zero indicating weak or no correlation.
Critical Thinking Alert: Remember that correlation doesn't prove causation! A scatter graph shows a relationship exists but can't tell you which variable causes the other—or if both are caused by something else entirely.
When you need to determine causation, you'll need to design an experiment where you can manipulate variables and control for outside factors. Correlational studies are great for identifying patterns, but experiments help establish cause and effect.
We thought you’d never ask...
Our AI companion is specifically built for the needs of students. Based on the millions of content pieces we have on the platform we can provide truly meaningful and relevant answers to students. But its not only about answers, the companion is even more about guiding students through their daily learning challenges, with personalised study plans, quizzes or content pieces in the chat and 100% personalisation based on the students skills and developments.
You can download the app in the Google Play Store and in the Apple App Store.
That's right! Enjoy free access to study content, connect with fellow students, and get instant help – all at your fingertips.
Similar Content
Most popular content: Descriptive Statistics
1Most popular content in Psychology
8Psychology 101 Notes
Notes: Chapters 1, 2, 3, 5, 6, 7, 8, 9
2,443104
bipolar disorder psyc353
adult psychopathology lecture notes
875
Psychosexual development
Sigmund Freud
1000
The Endocrine System and Nervous System
Unit 2 review
2827
Psychology | Chapter 8: Lifespan Development
Study guide on chapter 8, theories on how people develop over a lifetime. Information was from the textbook Introduction to Psychology by Hawkes Learning and supplemented by my professor's resources.
895
Social Development
Unit 6 review
531
Jean Piaget & Cognitive Development
This know covers everything you may need to know about Jean Piaget & his theory of Cognitive development, as well as explanations of each step of cognitive development
10th1293
Summary of the 4 Communication Skills
This is a summary I made for the 4 communication skills: Reading, writing, listening and speaking.
College642
Most popular content
9O
Origins and Dynamics of the Columbian Exchange
Analyze the ecological and economic motivations behind the initial transfer of goods, people, and diseases between the Old and New Worlds.
9th3,1280
I
Introduction to Early Cultural Interactions
Analyze the initial social and religious encounters between Europeans, Africans, and Indigenous peoples in the colonial Americas.
9th2,7730
O
Origins of Ancient River Civilizations
Analyze the environmental factors and technological innovations that led to the rise of early states in Mesopotamia, Egypt, and the Indus Valley.
9th3,1870
M
Motivations for European Exploration
Analyze the economic, religious, and political factors that drove European powers to the Americas during the 15th and 16th centuries.
9th1,7780
F
Foundations of Ethical Guidelines in Research
Practice the core principles of the APA ethical code including informed consent, debriefing, and the role of Institutional Review Boards.
9th1,3360
I
Introduction to Native American Societies
Examine the diverse social, political, and economic structures of North American indigenous groups prior to European contact.
9th1,1100
I
Introduction to the Spanish Encomienda System
Explore the fundamental economic and social structures of the Spanish colonial system, focusing on the encomienda and the casta social hierarchy.
9th8890
I
Introduction to Biological Elements of Life
Practice identifying the essential elements including carbon, nitrogen, phosphorus, and sulfur that compose biological macromolecules.
9th1,7410
O
Origins of the Articles of Confederation
Practice identifying the motivations for a weak central government and the specific powers granted to the states under the first U.S. constitution.
9th9370
Students love us — and so will you.
4.6/5App Store
4.7/5Google Play
The app is very easy to use and well designed. I have found everything I was looking for so far and have been able to learn a lot from the presentations! I will definitely use the app for a class assignment! And of course it also helps a lot as an inspiration.
Stefan SiOS user
This app is really great. There are so many study notes and help [...]. My problem subject is French, for example, and the app has so many options for help. Thanks to this app, I have improved my French. I would recommend it to anyone.
Samantha KlichAndroid user
Wow, I am really amazed. I just tried the app because I've seen it advertised many times and was absolutely stunned. This app is THE HELP you want for school and above all, it offers so many things, such as workouts and fact sheets, which have been VERY helpful to me personally.
AnnaiOS user
Understanding Data and Data Analysis
Data analysis is all about making sense of information collected in psychological studies. Understanding different types of data and how to analyze them helps us interpret research findings. This guide covers the basics of quantitative and qualitative data, along with...
1
of 5
Sign up to see the content. It's free!
- Access to all documents
- Improve your grades
- Join milions of students
Types of Data in Psychology
Ever wondered why some psychological studies use numbers while others use detailed descriptions? That's because researchers use two main types of data: quantitative and qualitative.
Quantitative data consists of numerical measurements like pulse rates or test scores. This type of data works well with experiments and correlational studies because it's objective and reliable. For example, counting how many times a behavior occurs or recording responses on a numerical scale requires little interpretation, making the data highly valid.
Qualitative data provides descriptive, in-depth information about psychological characteristics. Think of detailed observations or responses to open-ended questions in interviews. This type of data allows participants to express themselves fully without being limited to fixed choices, often making it more representative of real experiences.
Quick Comparison: Quantitative data is great for statistical analysis and objective comparison, while qualitative data captures rich details and unique perspectives that might get lost in numbers alone.
Each type has its strengths and weaknesses. Quantitative data is objective and reliable but might miss important details. Qualitative data provides depth but can be more subjective and difficult to generalize from small samples.
2
of 5Sign up to see the content. It's free!
- Access to all documents
- Improve your grades
- Join milions of students
Descriptive Statistics
Raw data from studies can be overwhelming! Descriptive statistics help us simplify and understand what the information actually means.
When organizing data, start with a summary table that includes a clear title and labeled rows and columns. For experimental data, these typically show the dependent variable measurements and the independent variable levels. Remember that units of measurement (like seconds) should appear once in the heading, not repeated in every cell.
Measures of central tendency help us find the "typical" score in a dataset. The mode is simply the most frequent score and works with any type of data, including categories. While easy to calculate, it doesn't consider the actual values of scores. The median identifies the middle score when data is arranged from smallest to largest. It's more informative than the mode and isn't easily influenced by extreme scores.
Pro Tip: When choosing between measures of central tendency, consider what you need to know. The mode works for categorical data, the median handles outliers well, and the mean gives you the mathematical average.
Both the mode and median have limitations. The mode can have multiple values if several scores occur equally often. The median, while resistant to outliers, doesn't take all score values into account like the mean does.
3
of 5Sign up to see the content. It's free!
- Access to all documents
- Improve your grades
- Join milions of students
The Mean and Measures of Spread
The mean (average) is calculated by adding all scores and dividing by the number of scores. It's the most informative measure of central tendency because it uses every score's actual value. The mean works only with numerical data on linear scales but gives a more complete picture than the mode or median.
Understanding how spread out your data is matters just as much as knowing the average. Measures of spread show whether scores cluster tightly around the average or vary widely. Two datasets can have identical means but completely different distributions!
The range is the simplest spread measure—just subtract the smallest value from the largest and add one. In psychology, we add one because we're measuring the gaps between points. While easy to calculate, the range only considers extreme values and doesn't tell you whether outliers are typical or unusual.
The standard deviation (SD) calculates the average difference between each score and the mean. It's more informative than the range because it considers every data point. A larger SD indicates greater variation in scores. When comparing groups, similar SDs suggest similar variation patterns. Unlike the range, the standard deviation isn't easily distorted by a few extreme scores.
Remember This: When data points cluster closely around the mean, the standard deviation is small. When scores are widely spread out, the SD is large.
4
of 5Sign up to see the content. It's free!
- Access to all documents
- Improve your grades
- Join milions of students
Visual Data Representation: Bar Charts and Histograms
Graphs make data patterns immediately visible in ways that tables of numbers can't. Different types of graphs serve different purposes.
Bar charts work best for data in discrete categories or when showing averages. The spaces between bars indicate that categories aren't related in a continuous way. When displaying experimental results in a bar chart, put the independent variable (IV) levels on the x-axis and the dependent variable (DV) measurements on the y-axis. Each bar represents either a total or an average for a category.
Histograms display continuous data and show how scores are distributed across a range. Unlike bar charts, histogram bars touch each other because they represent adjacent points on a continuous scale. The x-axis shows the DV values (often grouped into ranges like "ages 6-10"), while the y-axis shows how frequently each value occurs. If no scores fall within a particular range, you must leave a gap to show the empty category.
Visual Tip: Not sure whether to use a bar chart or histogram? Ask yourself if your data falls into distinct categories (bar chart) or represents points along a continuous scale (histogram).
Histograms are particularly useful for seeing the overall shape of your data distribution—whether it's normally distributed (bell curve), skewed to one side, or has multiple peaks.
5
of 5Sign up to see the content. It's free!
- Access to all documents
- Improve your grades
- Join milions of students
Scatter Graphs and Correlation
When studying relationships between two variables, scatter graphs are your best visual tool. Each dot represents one participant's scores on both variables.
In a scatter graph, patterns tell the story. If dots form an upward sloping pattern, there's a positive correlation—as one variable increases, so does the other. A downward slope shows a negative correlation—as one variable increases, the other decreases. When dots spread randomly with no clear pattern, there's likely no correlation.
The line of best fit draws through the cloud of dots to show the general trend. In strong correlations, dots cluster tightly near this line; in weak correlations, they're more scattered. Correlation strength is measured as an "r value" ranging from +1 (perfect positive) to -1 (perfect negative), with values near zero indicating weak or no correlation.
Critical Thinking Alert: Remember that correlation doesn't prove causation! A scatter graph shows a relationship exists but can't tell you which variable causes the other—or if both are caused by something else entirely.
When you need to determine causation, you'll need to design an experiment where you can manipulate variables and control for outside factors. Correlational studies are great for identifying patterns, but experiments help establish cause and effect.
We thought you’d never ask...
Our AI companion is specifically built for the needs of students. Based on the millions of content pieces we have on the platform we can provide truly meaningful and relevant answers to students. But its not only about answers, the companion is even more about guiding students through their daily learning challenges, with personalised study plans, quizzes or content pieces in the chat and 100% personalisation based on the students skills and developments.
You can download the app in the Google Play Store and in the Apple App Store.
That's right! Enjoy free access to study content, connect with fellow students, and get instant help – all at your fingertips.
Similar Content
Most popular content: Descriptive Statistics
1Most popular content in Psychology
8Psychology 101 Notes
Notes: Chapters 1, 2, 3, 5, 6, 7, 8, 9
2,443104
bipolar disorder psyc353
adult psychopathology lecture notes
875
Psychosexual development
Sigmund Freud
1000
The Endocrine System and Nervous System
Unit 2 review
2827
Psychology | Chapter 8: Lifespan Development
Study guide on chapter 8, theories on how people develop over a lifetime. Information was from the textbook Introduction to Psychology by Hawkes Learning and supplemented by my professor's resources.
895
Social Development
Unit 6 review
531
Jean Piaget & Cognitive Development
This know covers everything you may need to know about Jean Piaget & his theory of Cognitive development, as well as explanations of each step of cognitive development
10th1293
Summary of the 4 Communication Skills
This is a summary I made for the 4 communication skills: Reading, writing, listening and speaking.
College642
Most popular content
9O
Origins and Dynamics of the Columbian Exchange
Analyze the ecological and economic motivations behind the initial transfer of goods, people, and diseases between the Old and New Worlds.
9th3,1280
I
Introduction to Early Cultural Interactions
Analyze the initial social and religious encounters between Europeans, Africans, and Indigenous peoples in the colonial Americas.
9th2,7730
O
Origins of Ancient River Civilizations
Analyze the environmental factors and technological innovations that led to the rise of early states in Mesopotamia, Egypt, and the Indus Valley.
9th3,1870
M
Motivations for European Exploration
Analyze the economic, religious, and political factors that drove European powers to the Americas during the 15th and 16th centuries.
9th1,7780
F
Foundations of Ethical Guidelines in Research
Practice the core principles of the APA ethical code including informed consent, debriefing, and the role of Institutional Review Boards.
9th1,3360
I
Introduction to Native American Societies
Examine the diverse social, political, and economic structures of North American indigenous groups prior to European contact.
9th1,1100
I
Introduction to the Spanish Encomienda System
Explore the fundamental economic and social structures of the Spanish colonial system, focusing on the encomienda and the casta social hierarchy.
9th8890
I
Introduction to Biological Elements of Life
Practice identifying the essential elements including carbon, nitrogen, phosphorus, and sulfur that compose biological macromolecules.
9th1,7410
O
Origins of the Articles of Confederation
Practice identifying the motivations for a weak central government and the specific powers granted to the states under the first U.S. constitution.
9th9370
Students love us — and so will you.
4.6/5App Store
4.7/5Google Play
The app is very easy to use and well designed. I have found everything I was looking for so far and have been able to learn a lot from the presentations! I will definitely use the app for a class assignment! And of course it also helps a lot as an inspiration.
Stefan SiOS user
This app is really great. There are so many study notes and help [...]. My problem subject is French, for example, and the app has so many options for help. Thanks to this app, I have improved my French. I would recommend it to anyone.
Samantha KlichAndroid user
Wow, I am really amazed. I just tried the app because I've seen it advertised many times and was absolutely stunned. This app is THE HELP you want for school and above all, it offers so many things, such as workouts and fact sheets, which have been VERY helpful to me personally.
AnnaiOS user