Ready to conquer polynomial functions? This chapter dives into quadratic...
Understanding Polynomial and Rational Functions
sumehra@sumehra


1 / 6
1
of 6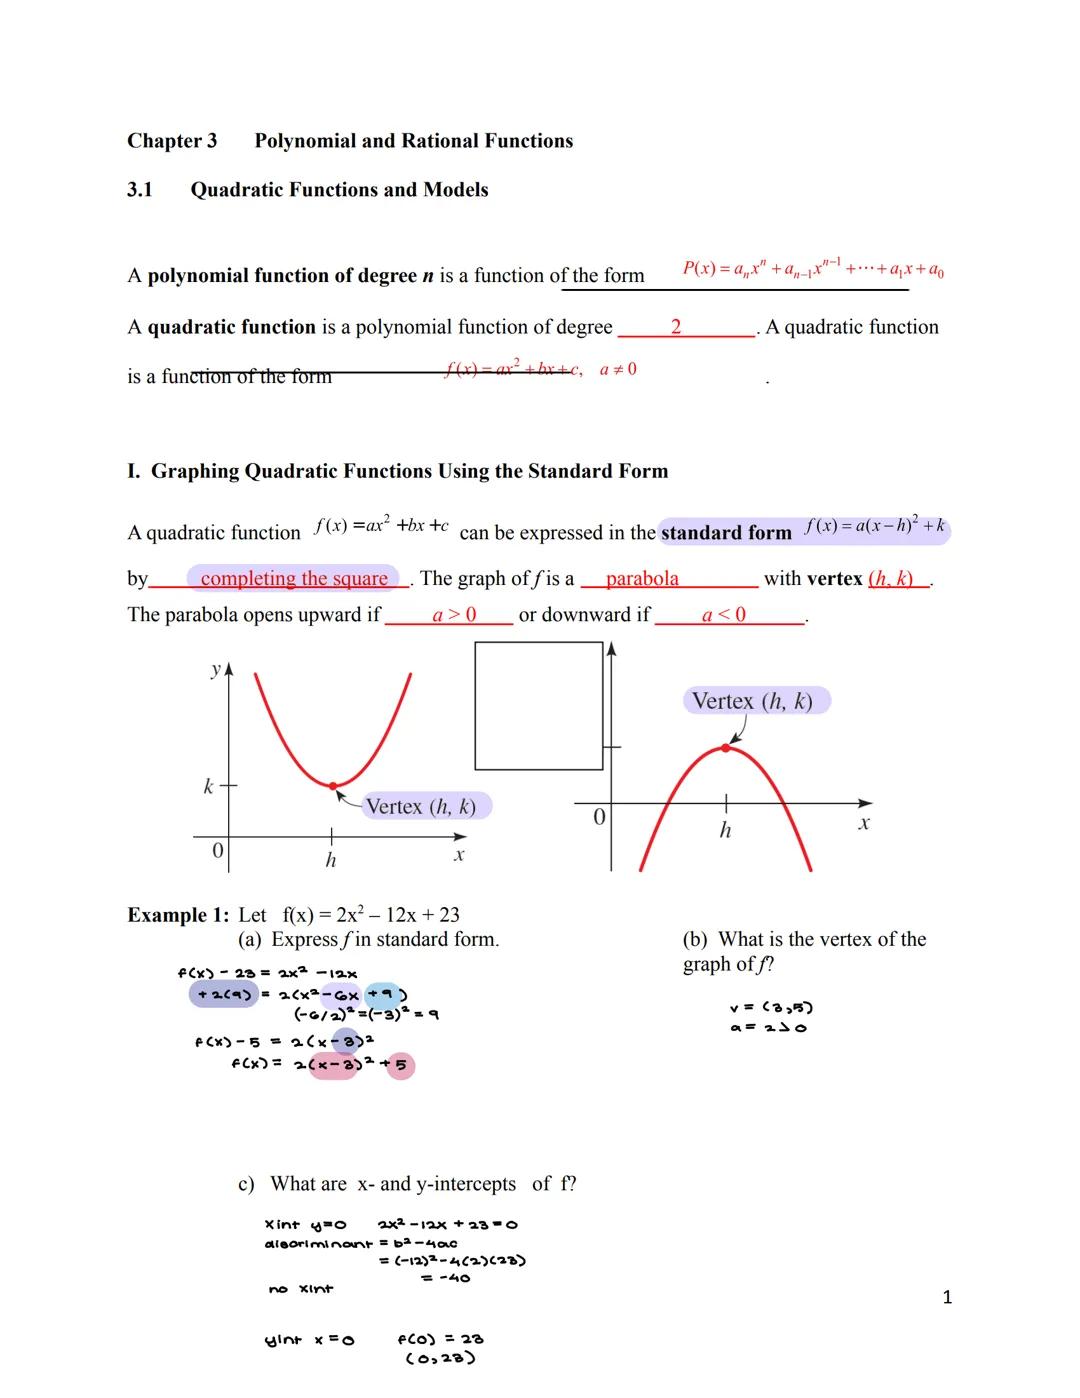
Quadratic Functions Basics
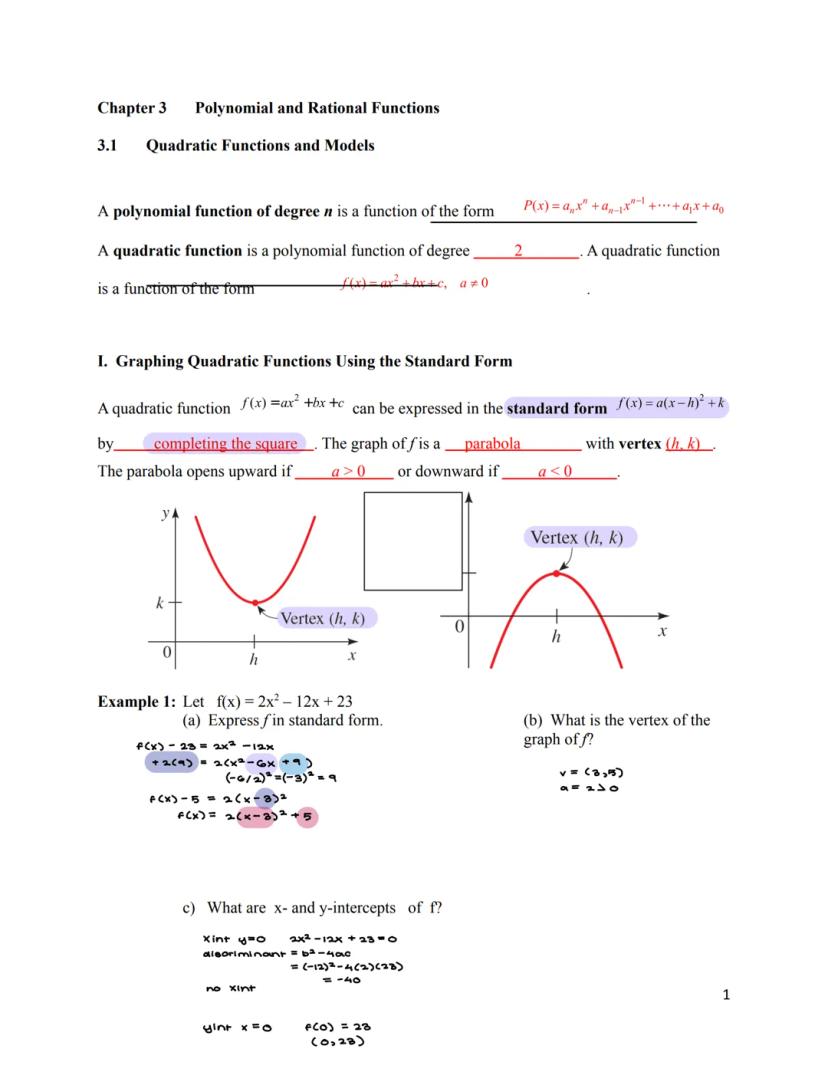
A quadratic function has the form f = ax² + bx + c where a ≠ 0. Every quadratic function creates a U-shaped curve called a parabola when graphed. The standard form f = a² + k tells you exactly where the parabola's lowest (or highest) point is.
The point (h, k) is called the vertex of the parabola. When a > 0, the parabola opens upward like a cup. When a < 0, it opens downward like an upside-down cup. Finding the vertex is crucial because it represents either the minimum or maximum value of the function.
To convert from general form to standard form, you need to "complete the square." This involves rearranging terms and adding/subtracting values to create a perfect square trinomial.
💡 Think of the standard form as giving you GPS coordinates for the vertex. The h tells you to go left/right, and the k tells you how high/low the vertex sits!
2
of 6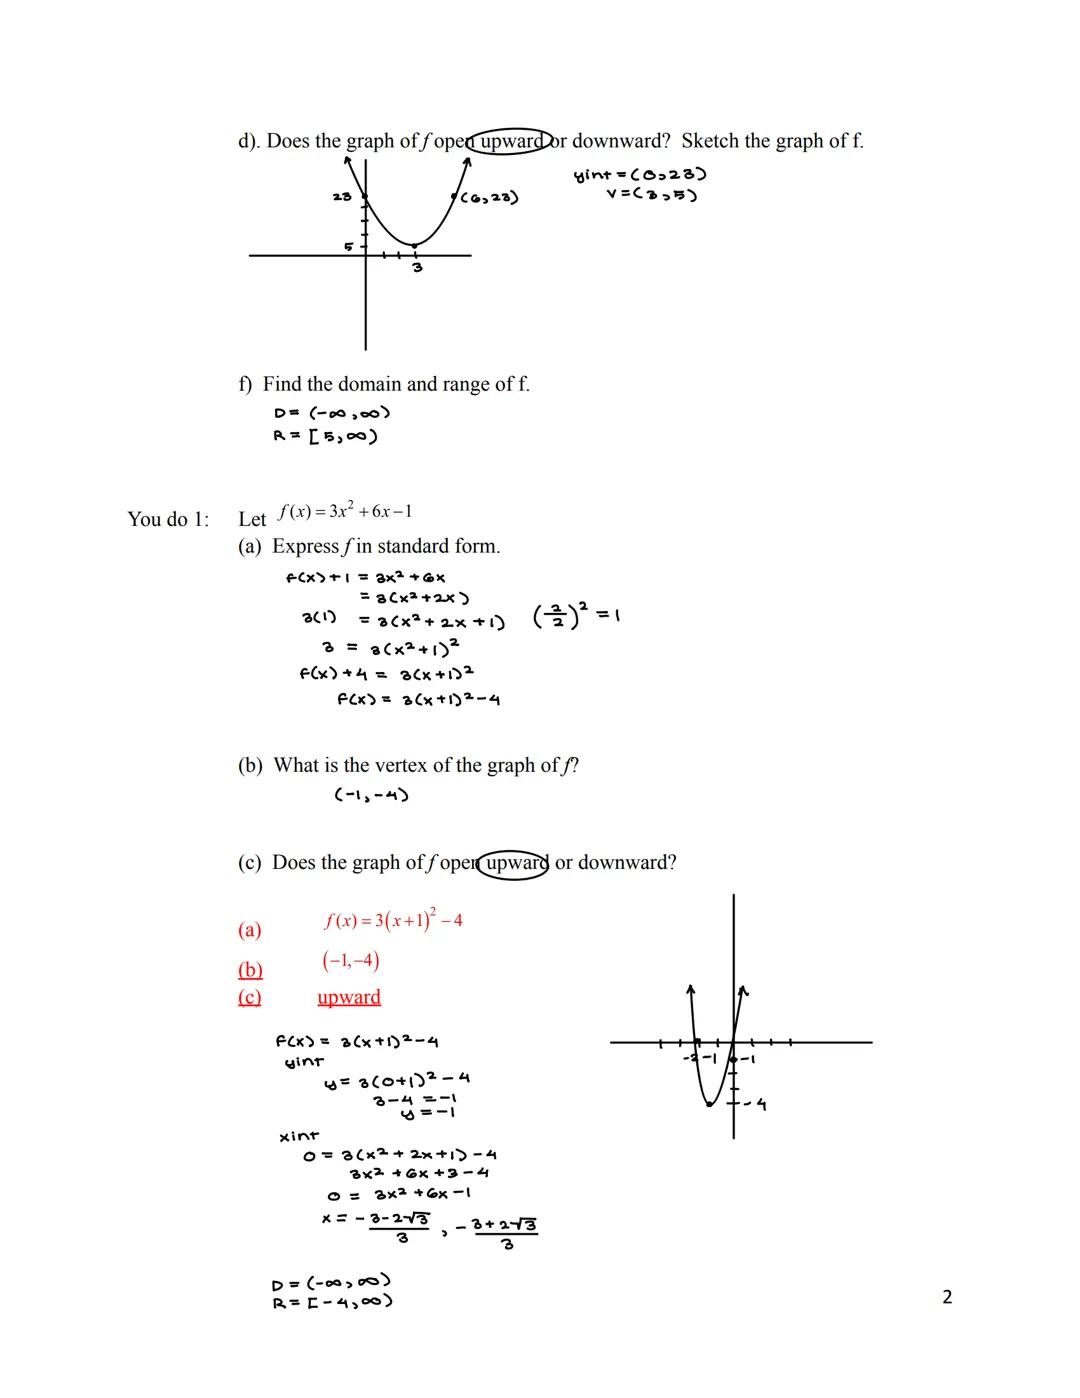
Graphing Quadratic Functions
When graphing a quadratic function, finding key points makes the process much easier. Start with the vertex - it's the turning point of your parabola. Then find the y-intercept by plugging in x = 0, which tells you where the parabola crosses the y-axis.
The x-intercepts (where the parabola crosses the x-axis) can be found by setting f = 0 and solving the equation. Not all quadratic functions have x-intercepts - it depends on whether the discriminant is positive, zero, or negative.
The domain of a quadratic function is always all real numbers (-∞, ∞), meaning you can input any value for x. The range depends on whether the parabola opens up or down. If it opens up, the range is [k, ∞), meaning the function never goes below the vertex. If it opens down, the range is (-∞, k].
🔍 Missing x-intercepts? Check the discriminant! If b² - 4ac < 0, your parabola never crosses the x-axis.
3
of 6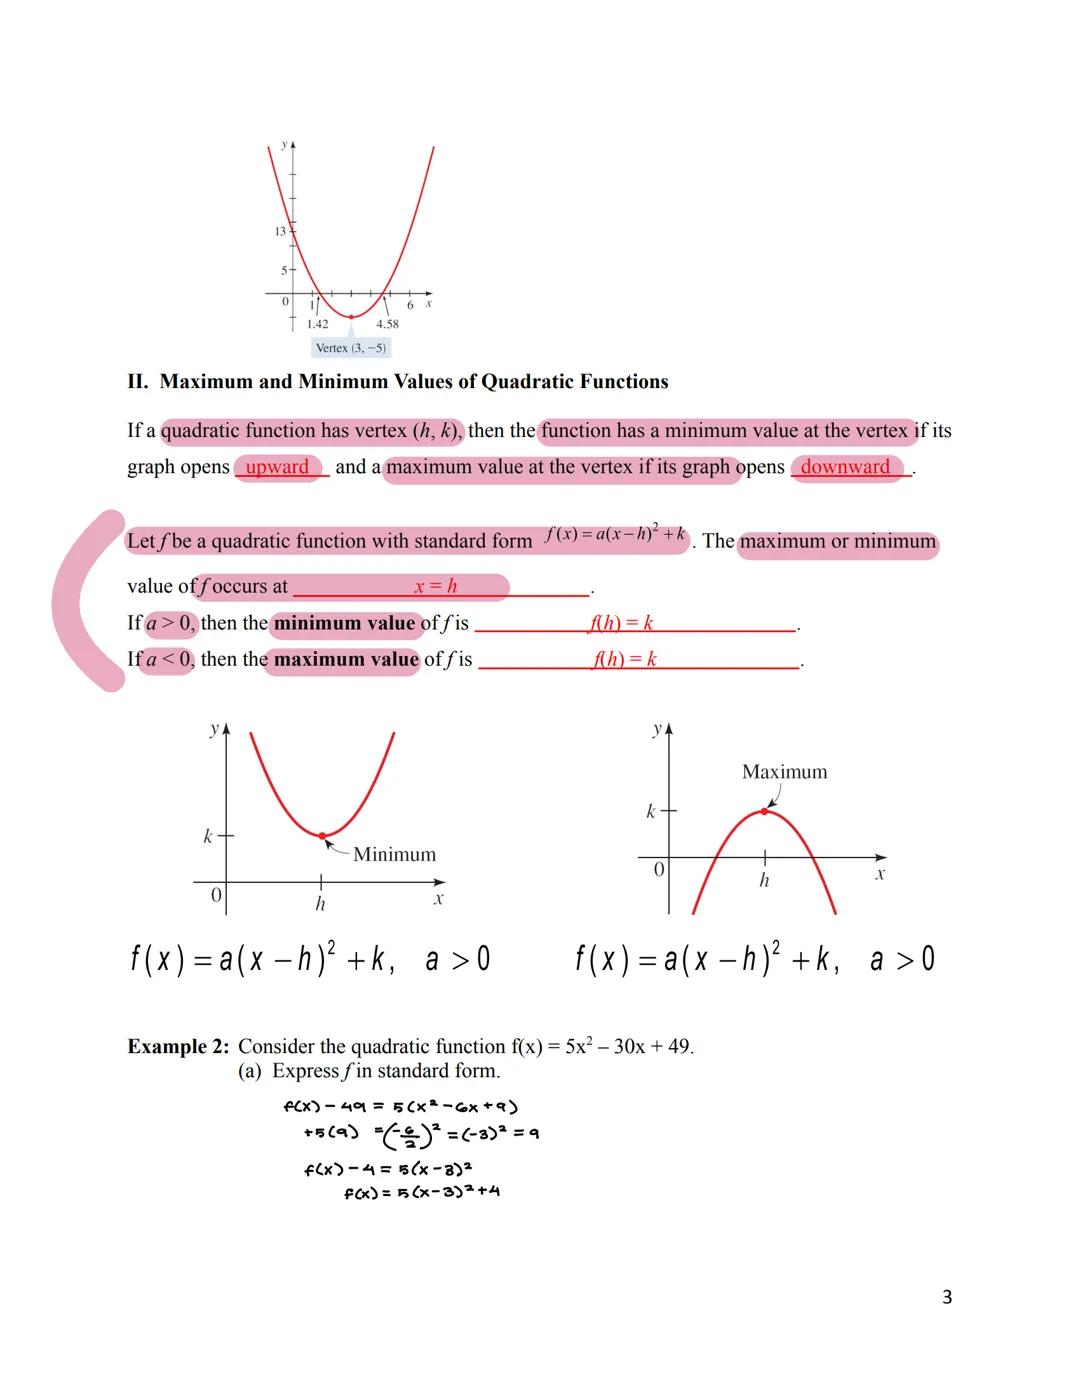
Maximum and Minimum Values
One of the most useful features of quadratic functions is their ability to model maximum or minimum values. The vertex (h, k) is where these extreme values occur. This is incredibly helpful for optimization problems!
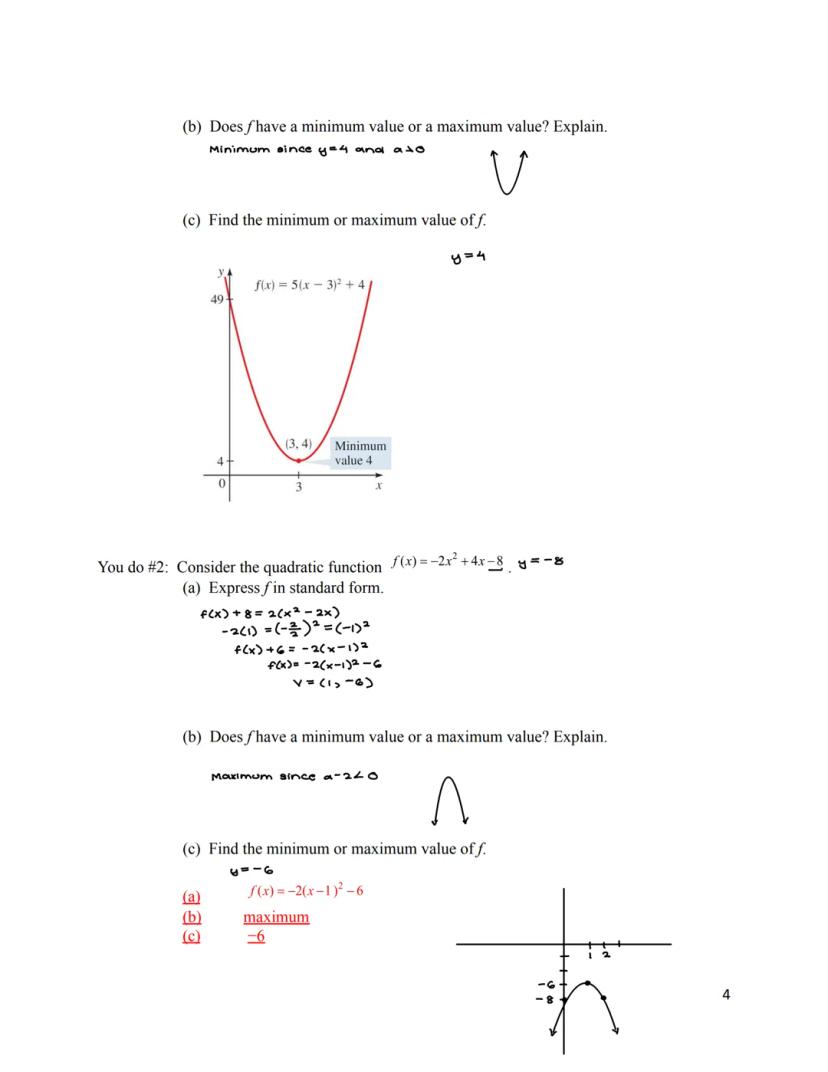
If a > 0 (parabola opens upward), the function has a minimum value of k at x = h. This means the output value can never go below k. If a < 0 (parabola opens downward), the function has a maximum value of k at x = h, meaning the output can never exceed k.
For a quadratic function in standard form f = a² + k, you can immediately identify whether it has a maximum or minimum and what that value is. This is why converting to standard form is so important in applications.
⭐ Remember: In any optimization problem involving a quadratic function, the vertex gives you the answer! It's either the maximum or minimum value you're looking for.
4
of 6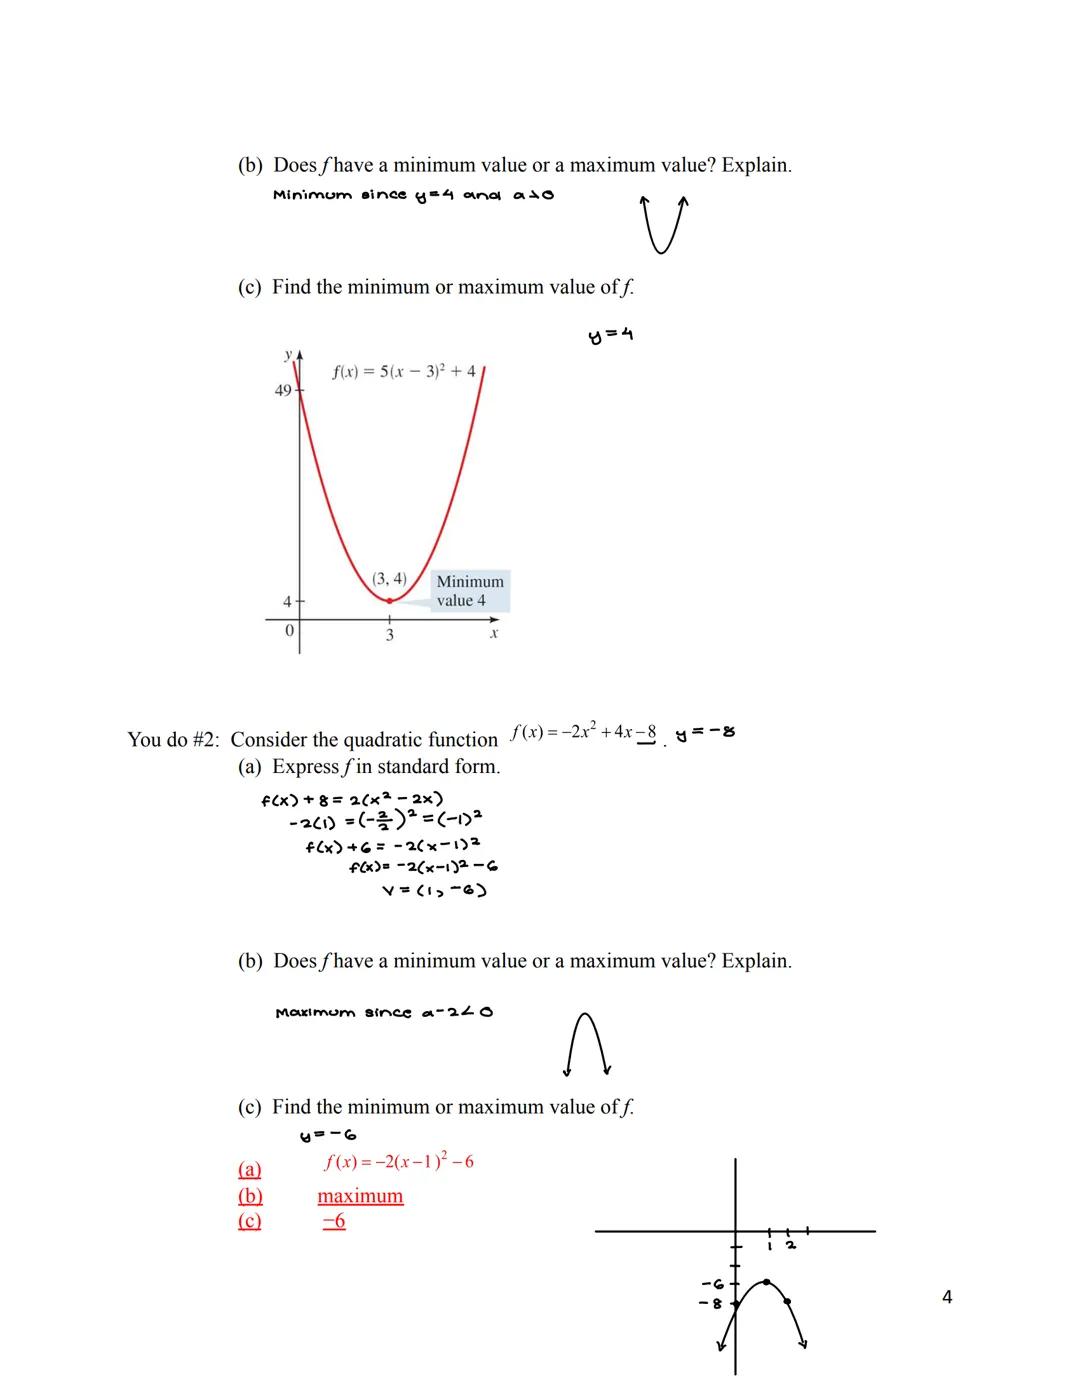
Finding Maximum and Minimum Values
When given a quadratic function in general form f = ax² + bx + c, you can find the maximum or minimum without converting to standard form. The x-value where this occurs is always at x = -b/(2a).
To find the actual maximum or minimum value, simply evaluate the function at this x-value. If a > 0, you've found the minimum value. If a < 0, you've found the maximum value.
This shortcut is incredibly useful for test questions and real-world problems. Instead of going through the entire process of converting to standard form, you can quickly identify where the extreme value occurs and what that value is.
🚀 Quick tip: The formula x = -b/(2a) is a time-saver on tests! Memorize it to find the vertex x-coordinate without completing the square.
5
of 6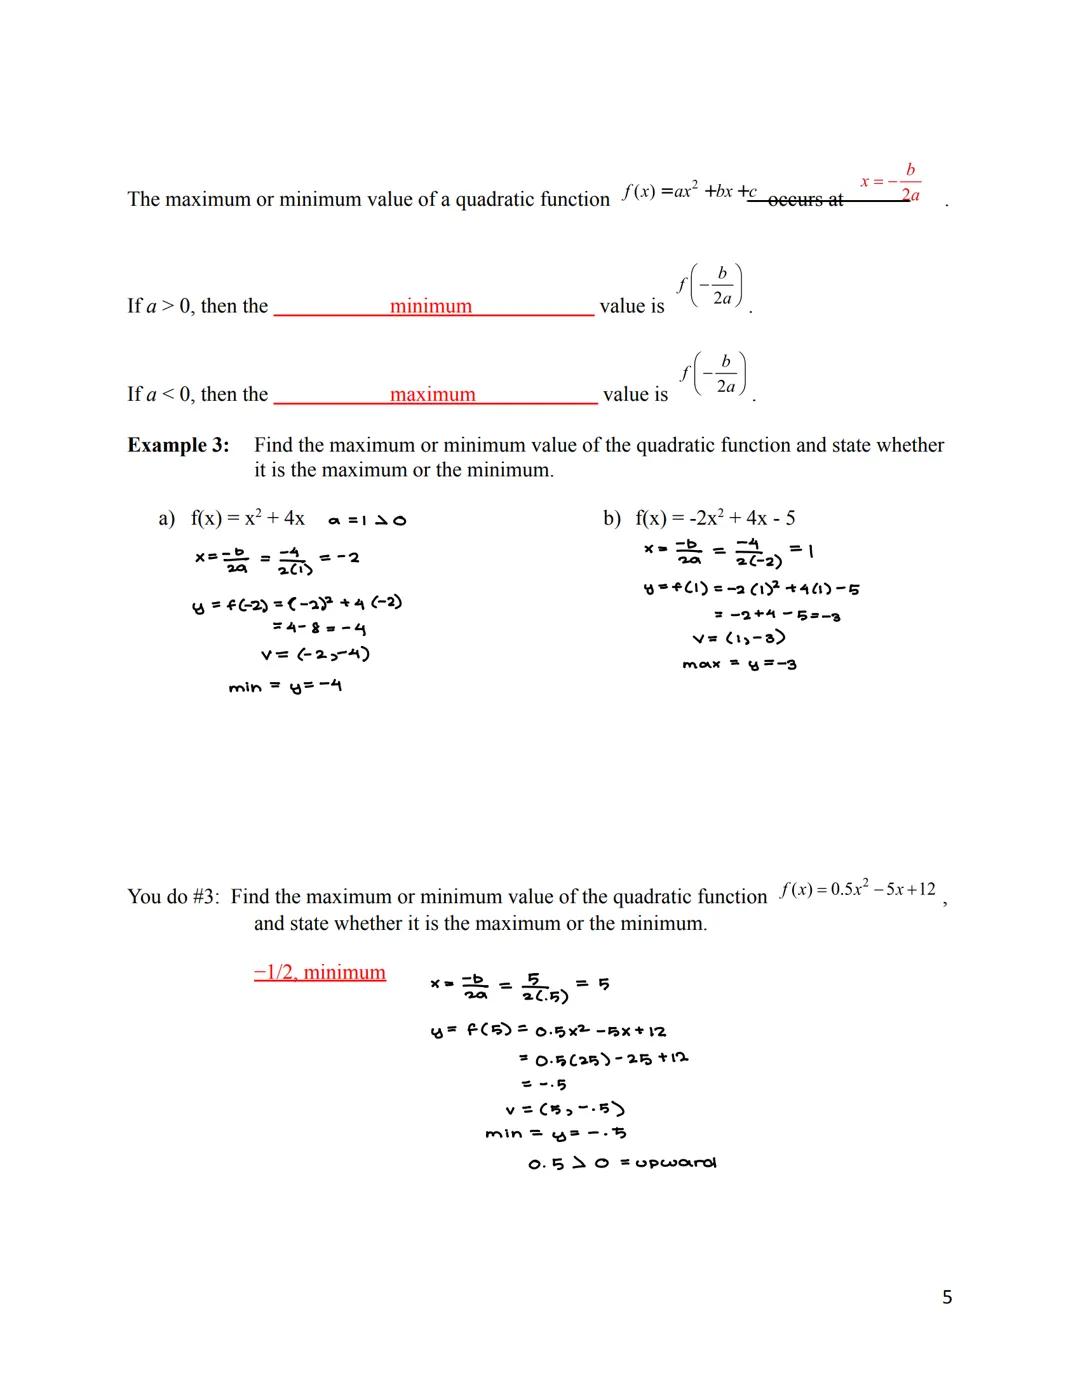
Application and Modeling
Quadratic functions appear everywhere in the real world! From the path of a thrown ball to profit models, these functions help us analyze situations where values increase and then decrease (or vice versa).
When working with application problems, identify the quantities being related and set up a quadratic function. Then find the maximum or minimum using the techniques we've learned. The vertex will often represent the optimal solution - like the maximum height of a projectile or the minimum cost of production.
For optimization problems, remember to check if any constraints exist. Sometimes the mathematical maximum or minimum might fall outside the practical range of values for the situation.
🌟 Real-life connection: Gas mileage often follows a quadratic pattern - too slow or too fast both waste fuel, while a medium speed maximizes efficiency!
6
of 6
Real-World Applications
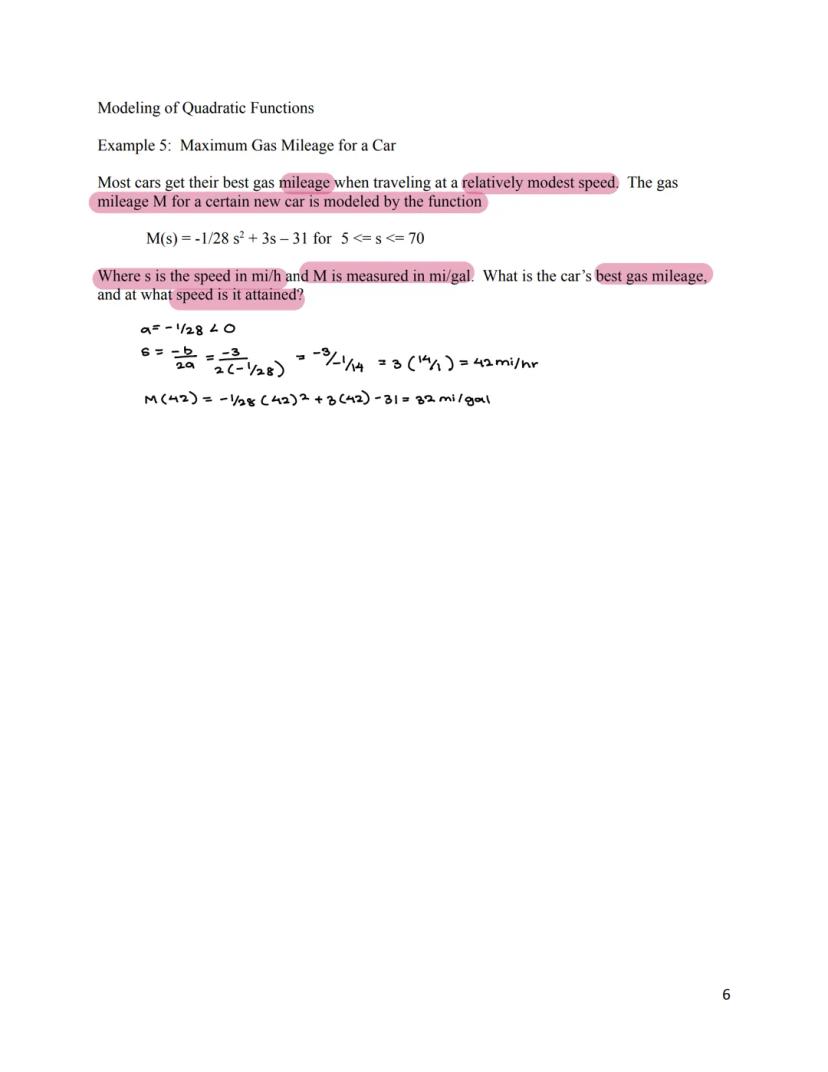
Quadratic functions are perfect for modeling situations with a clear maximum or minimum. For example, the gas mileage problem shows how efficiency first increases with speed, reaches an optimal point, then decreases at higher speeds.
In the car example, the gas mileage function M = -1/28s² + 3s - 31 models the relationship between speed and miles per gallon (M). By finding the vertex, we can determine the optimal speed for maximum efficiency.
To solve such problems, identify the coefficient values (a, b, c) and use the formula x = -b/(2a) to find where the maximum or minimum occurs. Then substitute this value back into the original function to find the optimal result.
🚗 Next time you're driving, remember that your car's optimal fuel efficiency isn't at the lowest or highest speed, but somewhere in the middle - just like a quadratic function predicts!
We thought you’d never ask...
Our AI companion is specifically built for the needs of students. Based on the millions of content pieces we have on the platform we can provide truly meaningful and relevant answers to students. But its not only about answers, the companion is even more about guiding students through their daily learning challenges, with personalised study plans, quizzes or content pieces in the chat and 100% personalisation based on the students skills and developments.
You can download the app in the Google Play Store and in the Apple App Store.
That's right! Enjoy free access to study content, connect with fellow students, and get instant help – all at your fingertips.
Similar Content
Most popular content: Standard Form of a Parabola
1Most popular content in Algebra 2
9Properties of Real Numbers
Notes about the topic
1412
1.2 - Intro to Sets
Sets, subsets, set builder notation
10th372
Special Right Triangles
Examples of two of the most common special right triangles.
11th2002
Linear Function: Solving Linear Equations in 1 Variable
Study note on linear equations with one variable, rules on linear equations, examples on simple linear equations, algebra 2, algebra 1
9th3341
Midterm Study Guide: Review of the First Half of the Course
Simple review notes and examples for the first half of the algebra 2 course! Not all classes teach the content in the same order, but this study guide should have most of the more basic concepts from algebra 2!
9th1,207120
Rational Exponents
Writing rational exponents in radical form and exponential form. And even and odd radicals
1535
math 3 final exam study guide
covers all content learned in tj math 3 (algebra 2)
10th1,660180
Absolute value functions
Steps to to solve absolute value functions
980
Transfermations - Quadratic Functions
Learn how to identify the vertex, direction, and maximum or minimum for different parabolas in vertex form.
10th640
Most popular content
9O
Origins and Dynamics of the Columbian Exchange
Analyze the ecological and economic motivations behind the initial transfer of goods, people, and diseases between the Old and New Worlds.
9th3,1280
I
Introduction to Early Cultural Interactions
Analyze the initial social and religious encounters between Europeans, Africans, and Indigenous peoples in the colonial Americas.
9th2,7730
O
Origins of Ancient River Civilizations
Analyze the environmental factors and technological innovations that led to the rise of early states in Mesopotamia, Egypt, and the Indus Valley.
9th3,1870
M
Motivations for European Exploration
Analyze the economic, religious, and political factors that drove European powers to the Americas during the 15th and 16th centuries.
9th1,7780
F
Foundations of Ethical Guidelines in Research
Practice the core principles of the APA ethical code including informed consent, debriefing, and the role of Institutional Review Boards.
9th1,3360
I
Introduction to Native American Societies
Examine the diverse social, political, and economic structures of North American indigenous groups prior to European contact.
9th1,1100
I
Introduction to the Spanish Encomienda System
Explore the fundamental economic and social structures of the Spanish colonial system, focusing on the encomienda and the casta social hierarchy.
9th8890
I
Introduction to Biological Elements of Life
Practice identifying the essential elements including carbon, nitrogen, phosphorus, and sulfur that compose biological macromolecules.
9th1,7410
O
Origins of the Articles of Confederation
Practice identifying the motivations for a weak central government and the specific powers granted to the states under the first U.S. constitution.
9th9370
Students love us — and so will you.
4.6/5App Store
4.7/5Google Play
The app is very easy to use and well designed. I have found everything I was looking for so far and have been able to learn a lot from the presentations! I will definitely use the app for a class assignment! And of course it also helps a lot as an inspiration.
Stefan SiOS user
This app is really great. There are so many study notes and help [...]. My problem subject is French, for example, and the app has so many options for help. Thanks to this app, I have improved my French. I would recommend it to anyone.
Samantha KlichAndroid user
Wow, I am really amazed. I just tried the app because I've seen it advertised many times and was absolutely stunned. This app is THE HELP you want for school and above all, it offers so many things, such as workouts and fact sheets, which have been VERY helpful to me personally.
AnnaiOS user
Understanding Polynomial and Rational Functions
sumehra@sumehra
Ready to conquer polynomial functions? This chapter dives into quadratic functions - those x² expressions that create parabolas on graphs. Understanding these functions helps you analyze real-world situations like maximum heights, minimum costs, and optimal speeds.
1
of 6
Sign up to see the content. It's free!
- Access to all documents
- Improve your grades
- Join milions of students
Quadratic Functions Basics
A quadratic function has the form f = ax² + bx + c where a ≠ 0. Every quadratic function creates a U-shaped curve called a parabola when graphed. The standard form f = a² + k tells you exactly where the parabola's lowest (or highest) point is.
The point (h, k) is called the vertex of the parabola. When a > 0, the parabola opens upward like a cup. When a < 0, it opens downward like an upside-down cup. Finding the vertex is crucial because it represents either the minimum or maximum value of the function.
To convert from general form to standard form, you need to "complete the square." This involves rearranging terms and adding/subtracting values to create a perfect square trinomial.
💡 Think of the standard form as giving you GPS coordinates for the vertex. The h tells you to go left/right, and the k tells you how high/low the vertex sits!
2
of 6Sign up to see the content. It's free!
- Access to all documents
- Improve your grades
- Join milions of students
Graphing Quadratic Functions
When graphing a quadratic function, finding key points makes the process much easier. Start with the vertex - it's the turning point of your parabola. Then find the y-intercept by plugging in x = 0, which tells you where the parabola crosses the y-axis.
The x-intercepts (where the parabola crosses the x-axis) can be found by setting f = 0 and solving the equation. Not all quadratic functions have x-intercepts - it depends on whether the discriminant is positive, zero, or negative.
The domain of a quadratic function is always all real numbers (-∞, ∞), meaning you can input any value for x. The range depends on whether the parabola opens up or down. If it opens up, the range is [k, ∞), meaning the function never goes below the vertex. If it opens down, the range is (-∞, k].
🔍 Missing x-intercepts? Check the discriminant! If b² - 4ac < 0, your parabola never crosses the x-axis.
3
of 6Sign up to see the content. It's free!
- Access to all documents
- Improve your grades
- Join milions of students
Maximum and Minimum Values
One of the most useful features of quadratic functions is their ability to model maximum or minimum values. The vertex (h, k) is where these extreme values occur. This is incredibly helpful for optimization problems!
If a > 0 (parabola opens upward), the function has a minimum value of k at x = h. This means the output value can never go below k. If a < 0 (parabola opens downward), the function has a maximum value of k at x = h, meaning the output can never exceed k.
For a quadratic function in standard form f = a² + k, you can immediately identify whether it has a maximum or minimum and what that value is. This is why converting to standard form is so important in applications.
⭐ Remember: In any optimization problem involving a quadratic function, the vertex gives you the answer! It's either the maximum or minimum value you're looking for.
4
of 6Sign up to see the content. It's free!
- Access to all documents
- Improve your grades
- Join milions of students
Finding Maximum and Minimum Values
When given a quadratic function in general form f = ax² + bx + c, you can find the maximum or minimum without converting to standard form. The x-value where this occurs is always at x = -b/(2a).
To find the actual maximum or minimum value, simply evaluate the function at this x-value. If a > 0, you've found the minimum value. If a < 0, you've found the maximum value.
This shortcut is incredibly useful for test questions and real-world problems. Instead of going through the entire process of converting to standard form, you can quickly identify where the extreme value occurs and what that value is.
🚀 Quick tip: The formula x = -b/(2a) is a time-saver on tests! Memorize it to find the vertex x-coordinate without completing the square.
5
of 6Sign up to see the content. It's free!
- Access to all documents
- Improve your grades
- Join milions of students
Application and Modeling
Quadratic functions appear everywhere in the real world! From the path of a thrown ball to profit models, these functions help us analyze situations where values increase and then decrease (or vice versa).
When working with application problems, identify the quantities being related and set up a quadratic function. Then find the maximum or minimum using the techniques we've learned. The vertex will often represent the optimal solution - like the maximum height of a projectile or the minimum cost of production.
For optimization problems, remember to check if any constraints exist. Sometimes the mathematical maximum or minimum might fall outside the practical range of values for the situation.
🌟 Real-life connection: Gas mileage often follows a quadratic pattern - too slow or too fast both waste fuel, while a medium speed maximizes efficiency!
6
of 6Sign up to see the content. It's free!
- Access to all documents
- Improve your grades
- Join milions of students
Real-World Applications
Quadratic functions are perfect for modeling situations with a clear maximum or minimum. For example, the gas mileage problem shows how efficiency first increases with speed, reaches an optimal point, then decreases at higher speeds.
In the car example, the gas mileage function M = -1/28s² + 3s - 31 models the relationship between speed and miles per gallon (M). By finding the vertex, we can determine the optimal speed for maximum efficiency.
To solve such problems, identify the coefficient values (a, b, c) and use the formula x = -b/(2a) to find where the maximum or minimum occurs. Then substitute this value back into the original function to find the optimal result.
🚗 Next time you're driving, remember that your car's optimal fuel efficiency isn't at the lowest or highest speed, but somewhere in the middle - just like a quadratic function predicts!
We thought you’d never ask...
Our AI companion is specifically built for the needs of students. Based on the millions of content pieces we have on the platform we can provide truly meaningful and relevant answers to students. But its not only about answers, the companion is even more about guiding students through their daily learning challenges, with personalised study plans, quizzes or content pieces in the chat and 100% personalisation based on the students skills and developments.
You can download the app in the Google Play Store and in the Apple App Store.
That's right! Enjoy free access to study content, connect with fellow students, and get instant help – all at your fingertips.
Similar Content
Most popular content: Standard Form of a Parabola
1Most popular content in Algebra 2
9Properties of Real Numbers
Notes about the topic
1412
1.2 - Intro to Sets
Sets, subsets, set builder notation
10th372
Special Right Triangles
Examples of two of the most common special right triangles.
11th2002
Linear Function: Solving Linear Equations in 1 Variable
Study note on linear equations with one variable, rules on linear equations, examples on simple linear equations, algebra 2, algebra 1
9th3341
Midterm Study Guide: Review of the First Half of the Course
Simple review notes and examples for the first half of the algebra 2 course! Not all classes teach the content in the same order, but this study guide should have most of the more basic concepts from algebra 2!
9th1,207120
Rational Exponents
Writing rational exponents in radical form and exponential form. And even and odd radicals
1535
math 3 final exam study guide
covers all content learned in tj math 3 (algebra 2)
10th1,660180
Absolute value functions
Steps to to solve absolute value functions
980
Transfermations - Quadratic Functions
Learn how to identify the vertex, direction, and maximum or minimum for different parabolas in vertex form.
10th640
Most popular content
9O
Origins and Dynamics of the Columbian Exchange
Analyze the ecological and economic motivations behind the initial transfer of goods, people, and diseases between the Old and New Worlds.
9th3,1280
I
Introduction to Early Cultural Interactions
Analyze the initial social and religious encounters between Europeans, Africans, and Indigenous peoples in the colonial Americas.
9th2,7730
O
Origins of Ancient River Civilizations
Analyze the environmental factors and technological innovations that led to the rise of early states in Mesopotamia, Egypt, and the Indus Valley.
9th3,1870
M
Motivations for European Exploration
Analyze the economic, religious, and political factors that drove European powers to the Americas during the 15th and 16th centuries.
9th1,7780
F
Foundations of Ethical Guidelines in Research
Practice the core principles of the APA ethical code including informed consent, debriefing, and the role of Institutional Review Boards.
9th1,3360
I
Introduction to Native American Societies
Examine the diverse social, political, and economic structures of North American indigenous groups prior to European contact.
9th1,1100
I
Introduction to the Spanish Encomienda System
Explore the fundamental economic and social structures of the Spanish colonial system, focusing on the encomienda and the casta social hierarchy.
9th8890
I
Introduction to Biological Elements of Life
Practice identifying the essential elements including carbon, nitrogen, phosphorus, and sulfur that compose biological macromolecules.
9th1,7410
O
Origins of the Articles of Confederation
Practice identifying the motivations for a weak central government and the specific powers granted to the states under the first U.S. constitution.
9th9370
Students love us — and so will you.
4.6/5App Store
4.7/5Google Play
The app is very easy to use and well designed. I have found everything I was looking for so far and have been able to learn a lot from the presentations! I will definitely use the app for a class assignment! And of course it also helps a lot as an inspiration.
Stefan SiOS user
This app is really great. There are so many study notes and help [...]. My problem subject is French, for example, and the app has so many options for help. Thanks to this app, I have improved my French. I would recommend it to anyone.
Samantha KlichAndroid user
Wow, I am really amazed. I just tried the app because I've seen it advertised many times and was absolutely stunned. This app is THE HELP you want for school and above all, it offers so many things, such as workouts and fact sheets, which have been VERY helpful to me personally.
AnnaiOS user