Understanding Acceleration
Acceleration is simply how quickly something changes its speed over time. Think of it as the "oomph" that makes objects go faster or slower - from a sprinter leaving the starting blocks to a car braking at a red light.
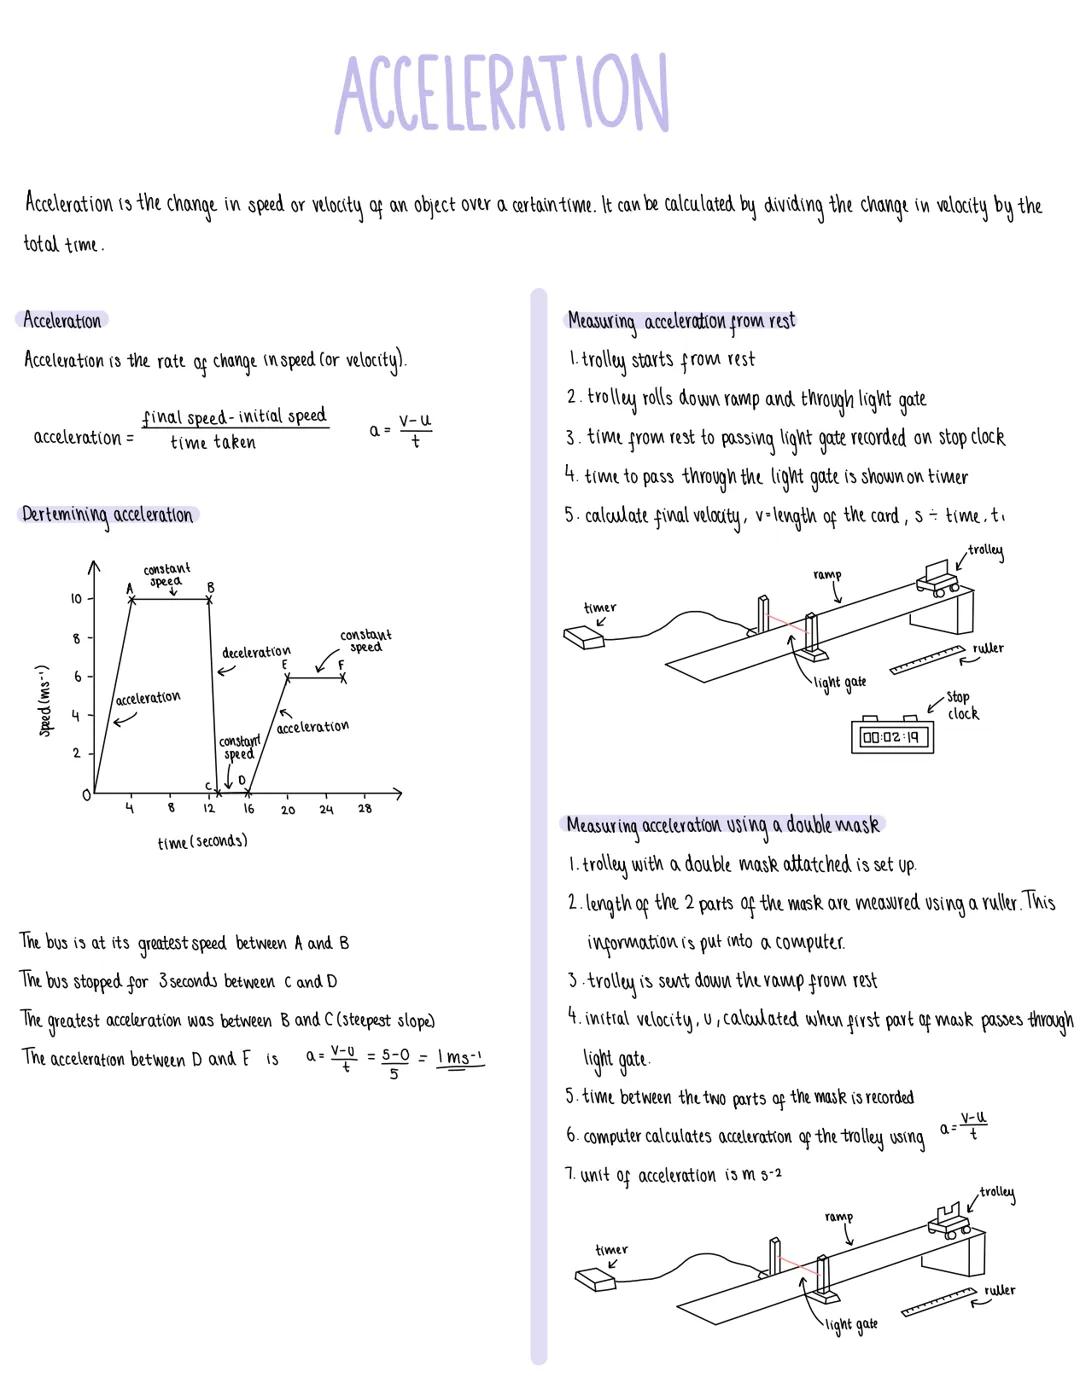
The formula is straightforward: acceleration = finalspeed−initialspeed ÷ time taken. In physics notation, that's a = v−u ÷ t. The unit is metres per second squared m/s2, which might sound odd but makes perfect sense when you think about it.
Speed-time graphs are brilliant for visualising acceleration. The steepest slope shows the greatest acceleration - just like the steepest hill makes you speed up fastest on a bike. Horizontal lines mean constant speed (no acceleration), while downward slopes show deceleration.
Top Tip: Remember that deceleration is just negative acceleration - the maths works exactly the same way!
Measuring Acceleration Practically
You'll likely encounter two main experimental methods for measuring acceleration in your practicals. The light gate method is dead simple - a trolley rolls down a ramp, passes through a light beam, and computers do the timing calculations for you.
The double mask method is slightly more sophisticated. A trolley has two sections (masks) attached, and as each section breaks the light beam, the computer calculates both initial and final velocities. This gives much more accurate results than stopwatch timing.
Both methods follow the same principle: measure distance, time the motion, calculate velocities, then use the acceleration formula. The beauty is that modern data logging does most of the hard work for you - you just need to understand what's happening and interpret the results correctly.